']

Analyse your performance. Simple, quick and comprehensive.

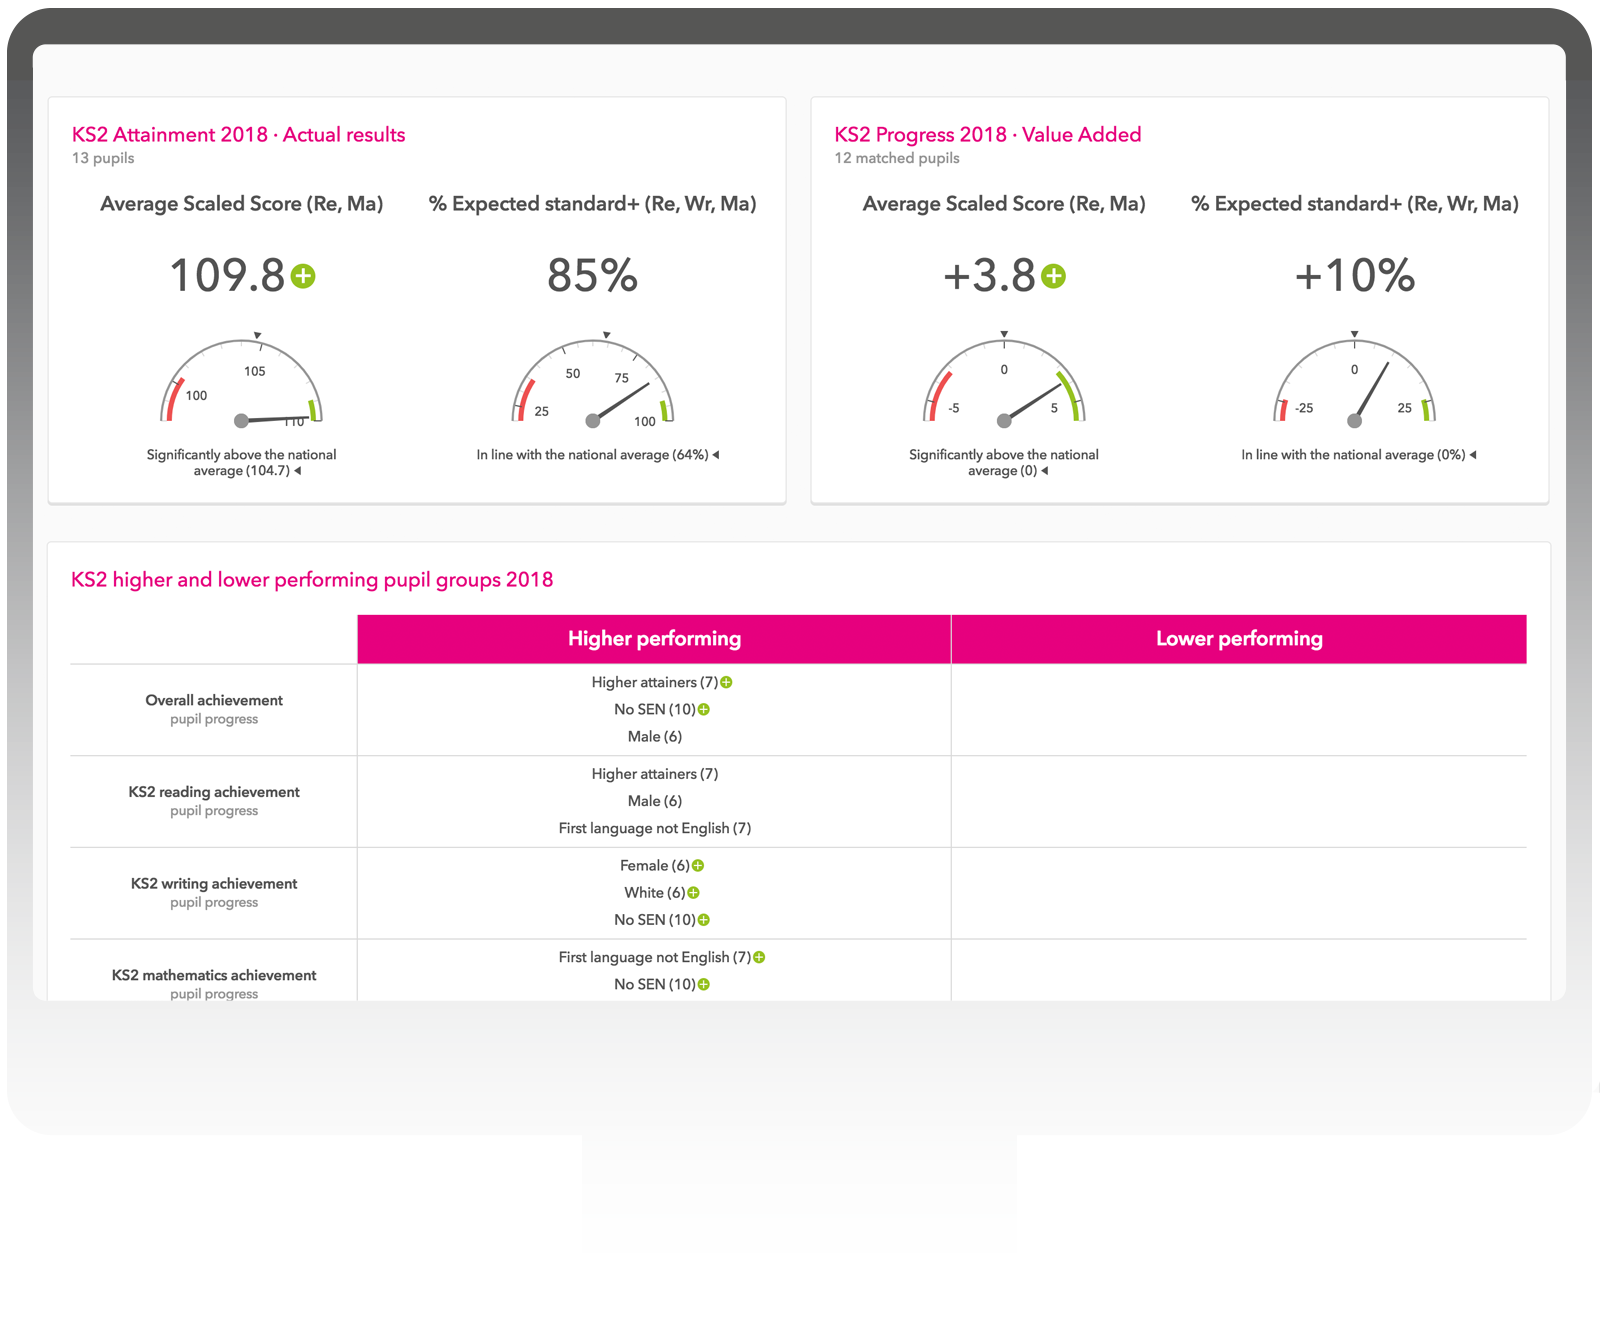
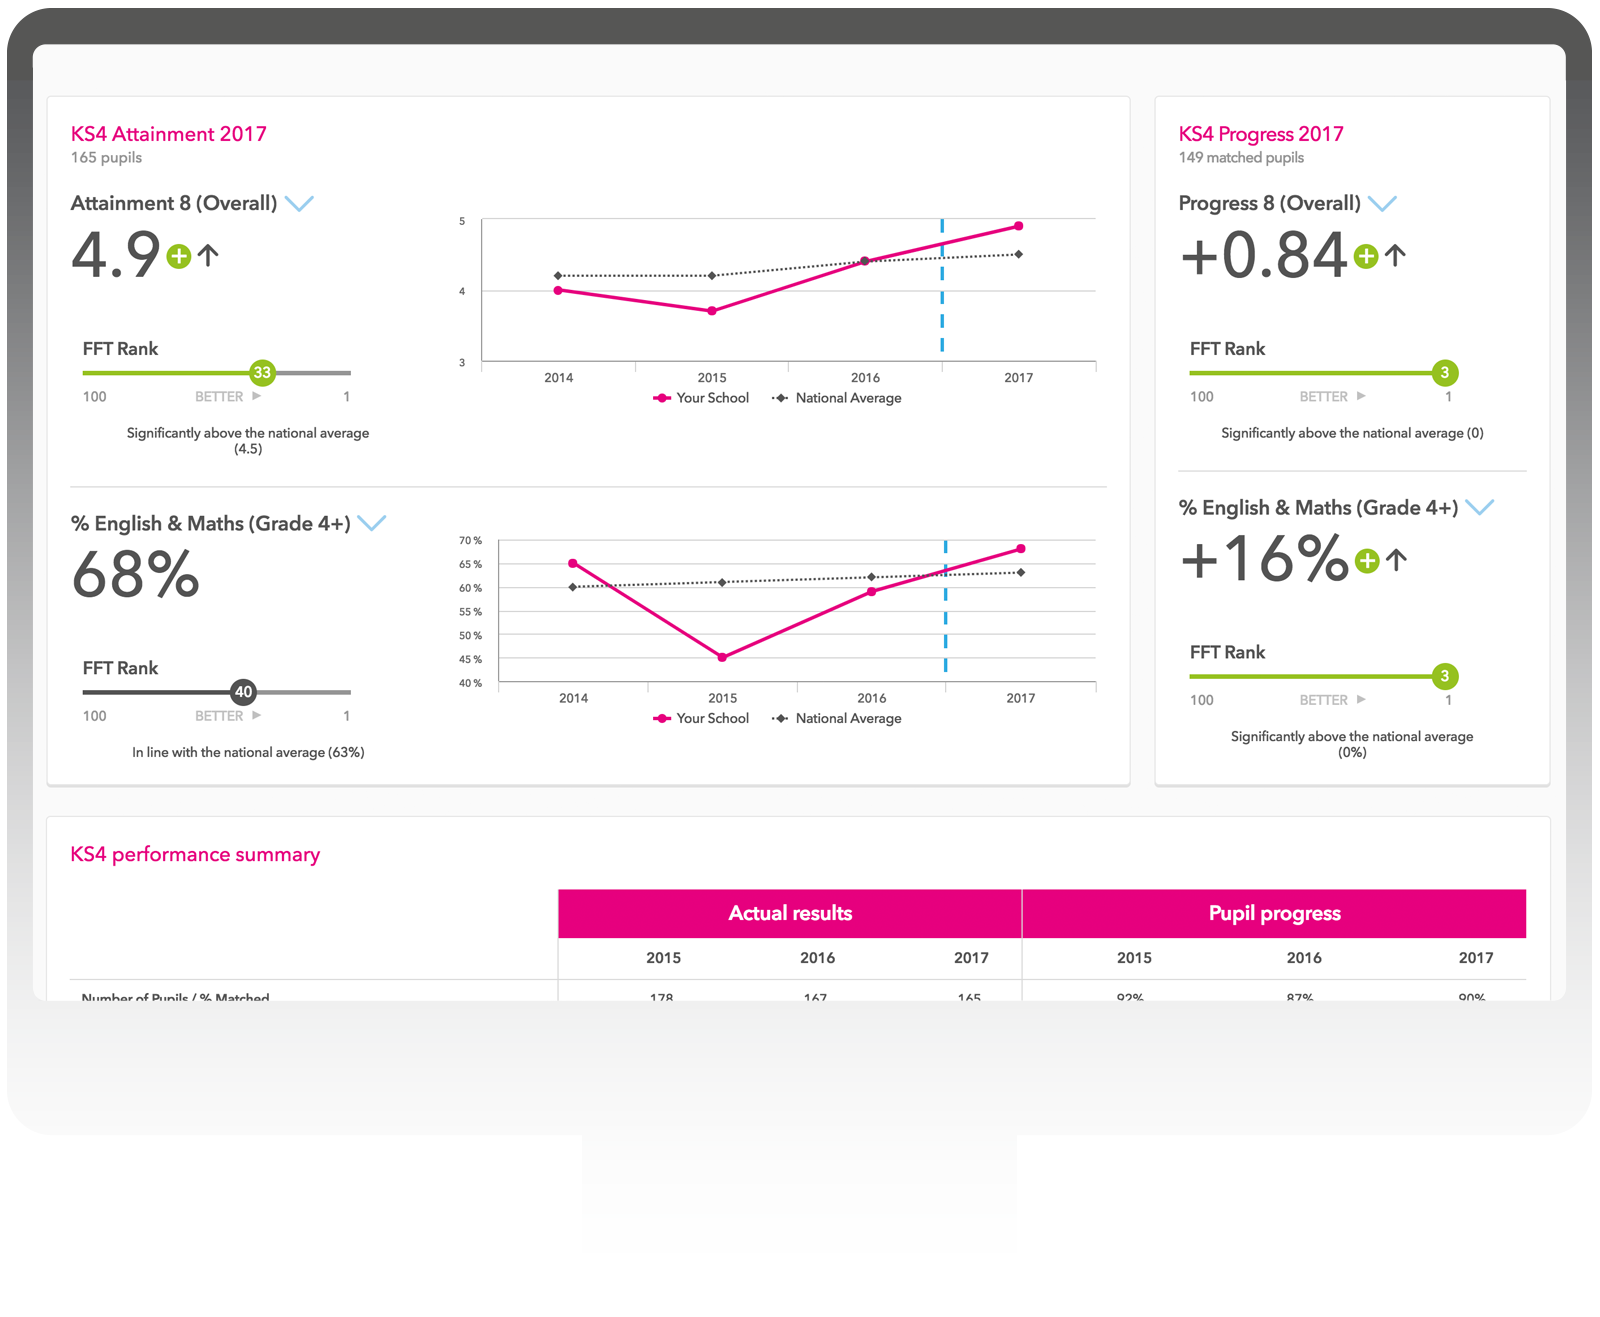
Analysing your performance is simple in Aspire. Our self-evaluation dashboards are made up of 8 easy-to-understand reports. Utilising a range of simple gauges, charts and tables, the dashboards allow you to quickly compare your attainment and progress to both national data and similar schools.

Download an example KS1 Aspire dashboardDownload an example KS2 Aspire dashboardDownload an example KS4 Aspire dashboardRequest a dashboard for your school

Overview

Attainment & progress

Pupil groups

Subjects

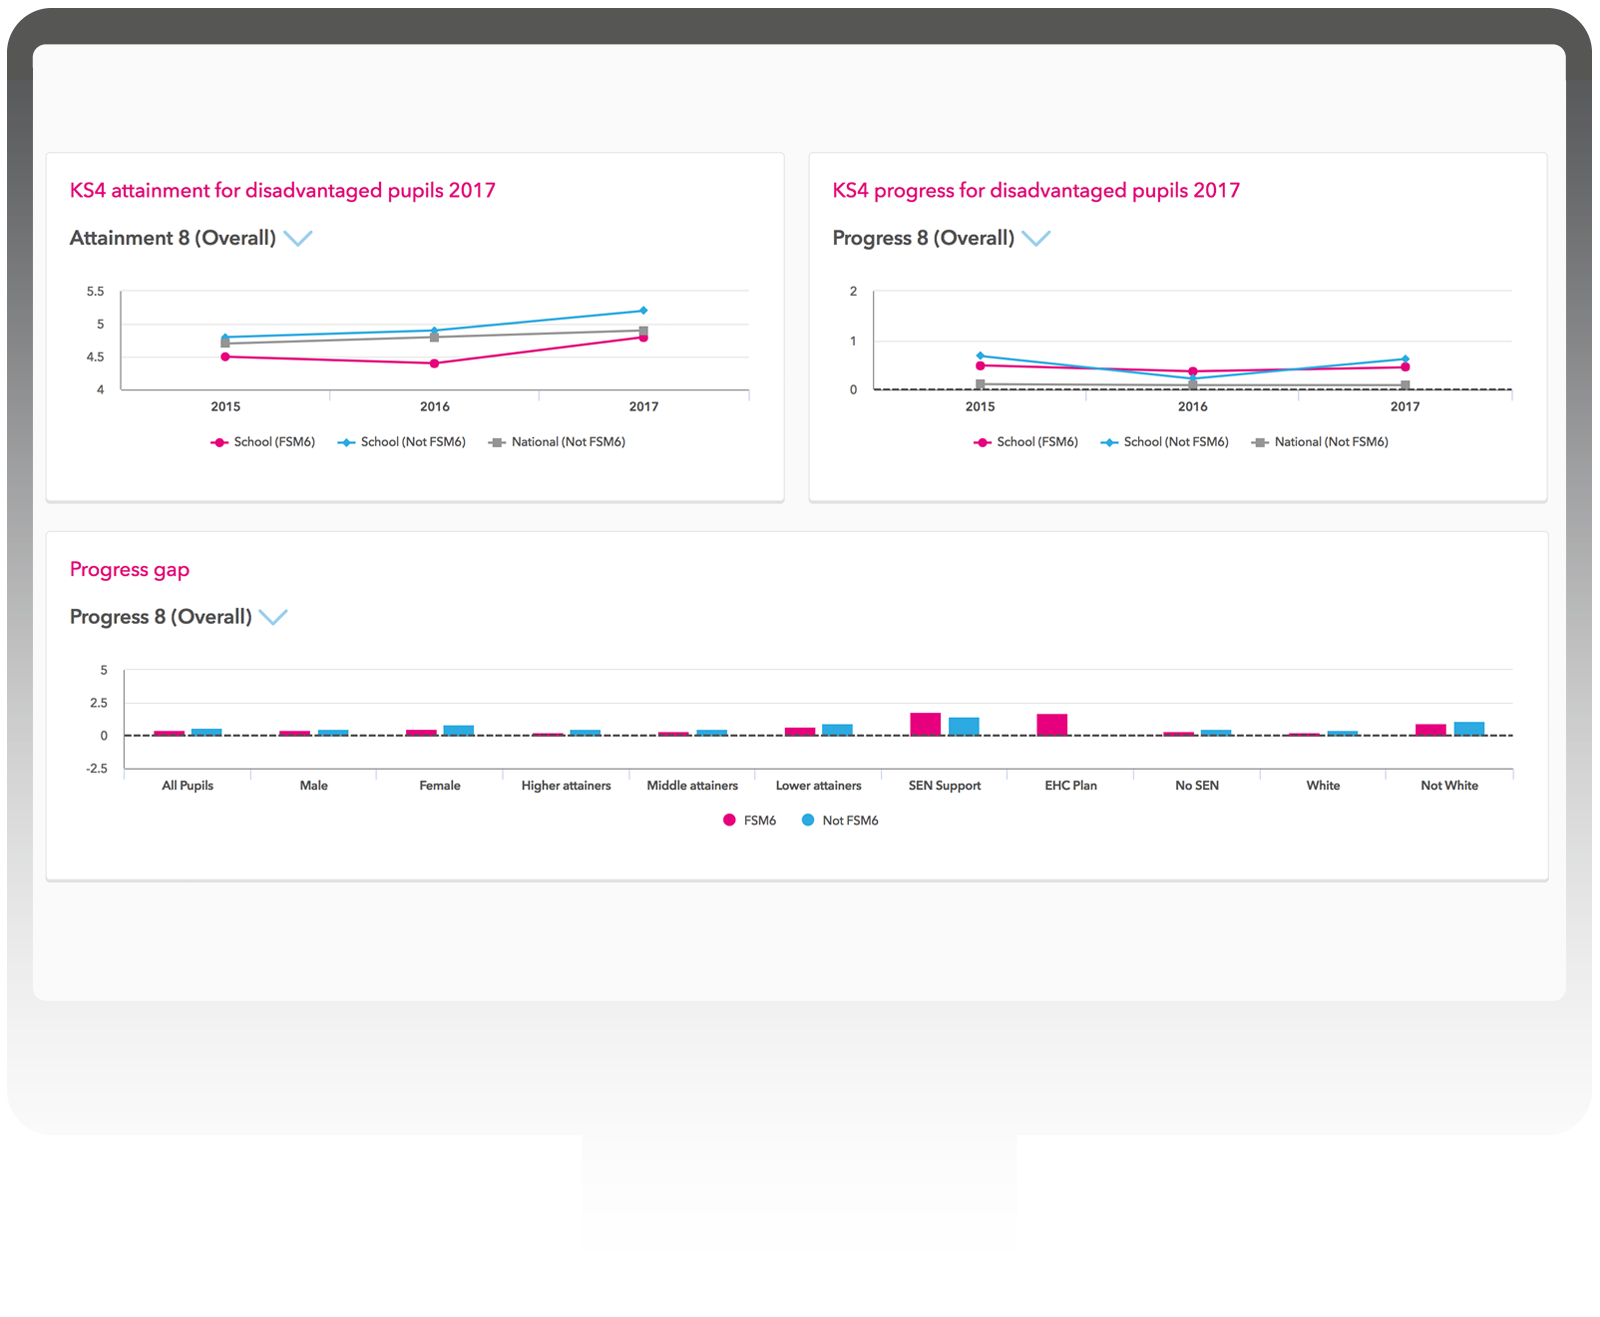
Disadvantaged pupils

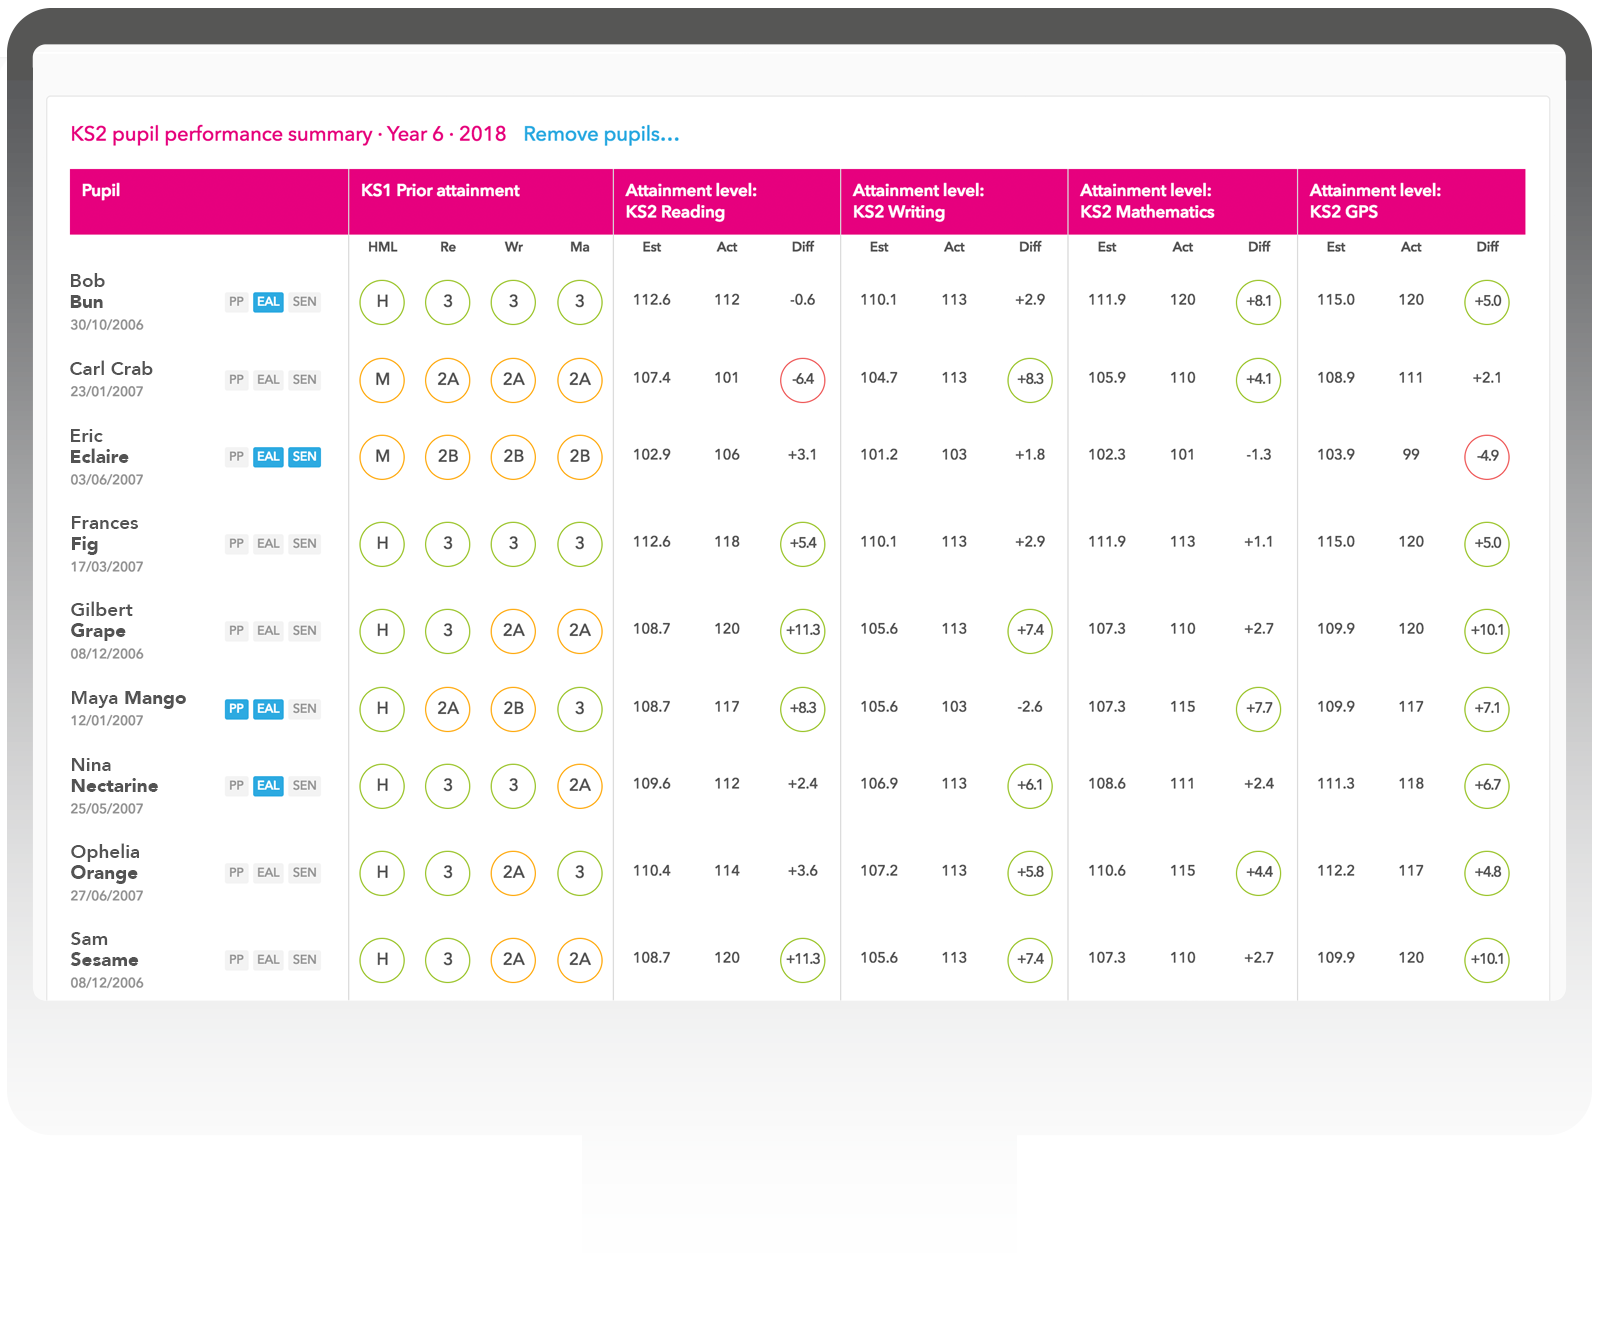
Pupils

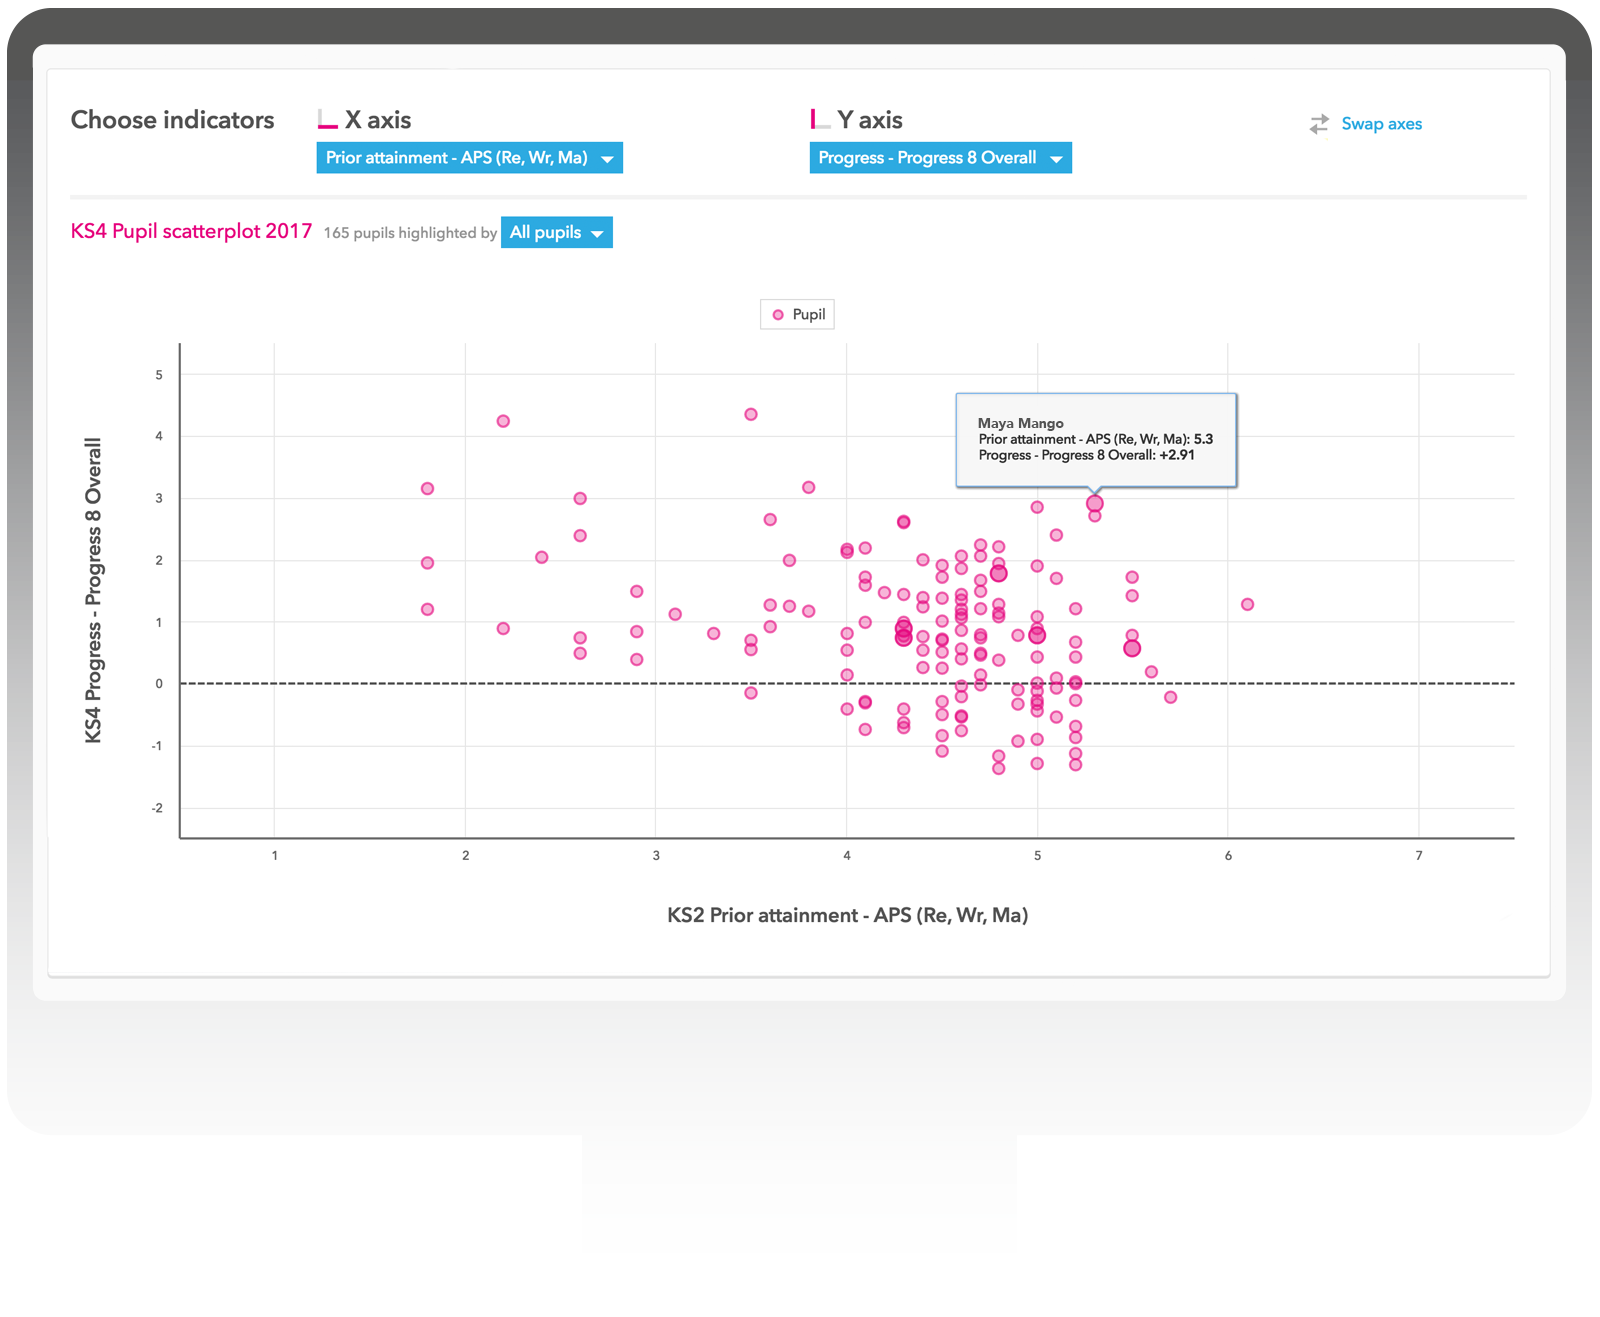
Scatterplot

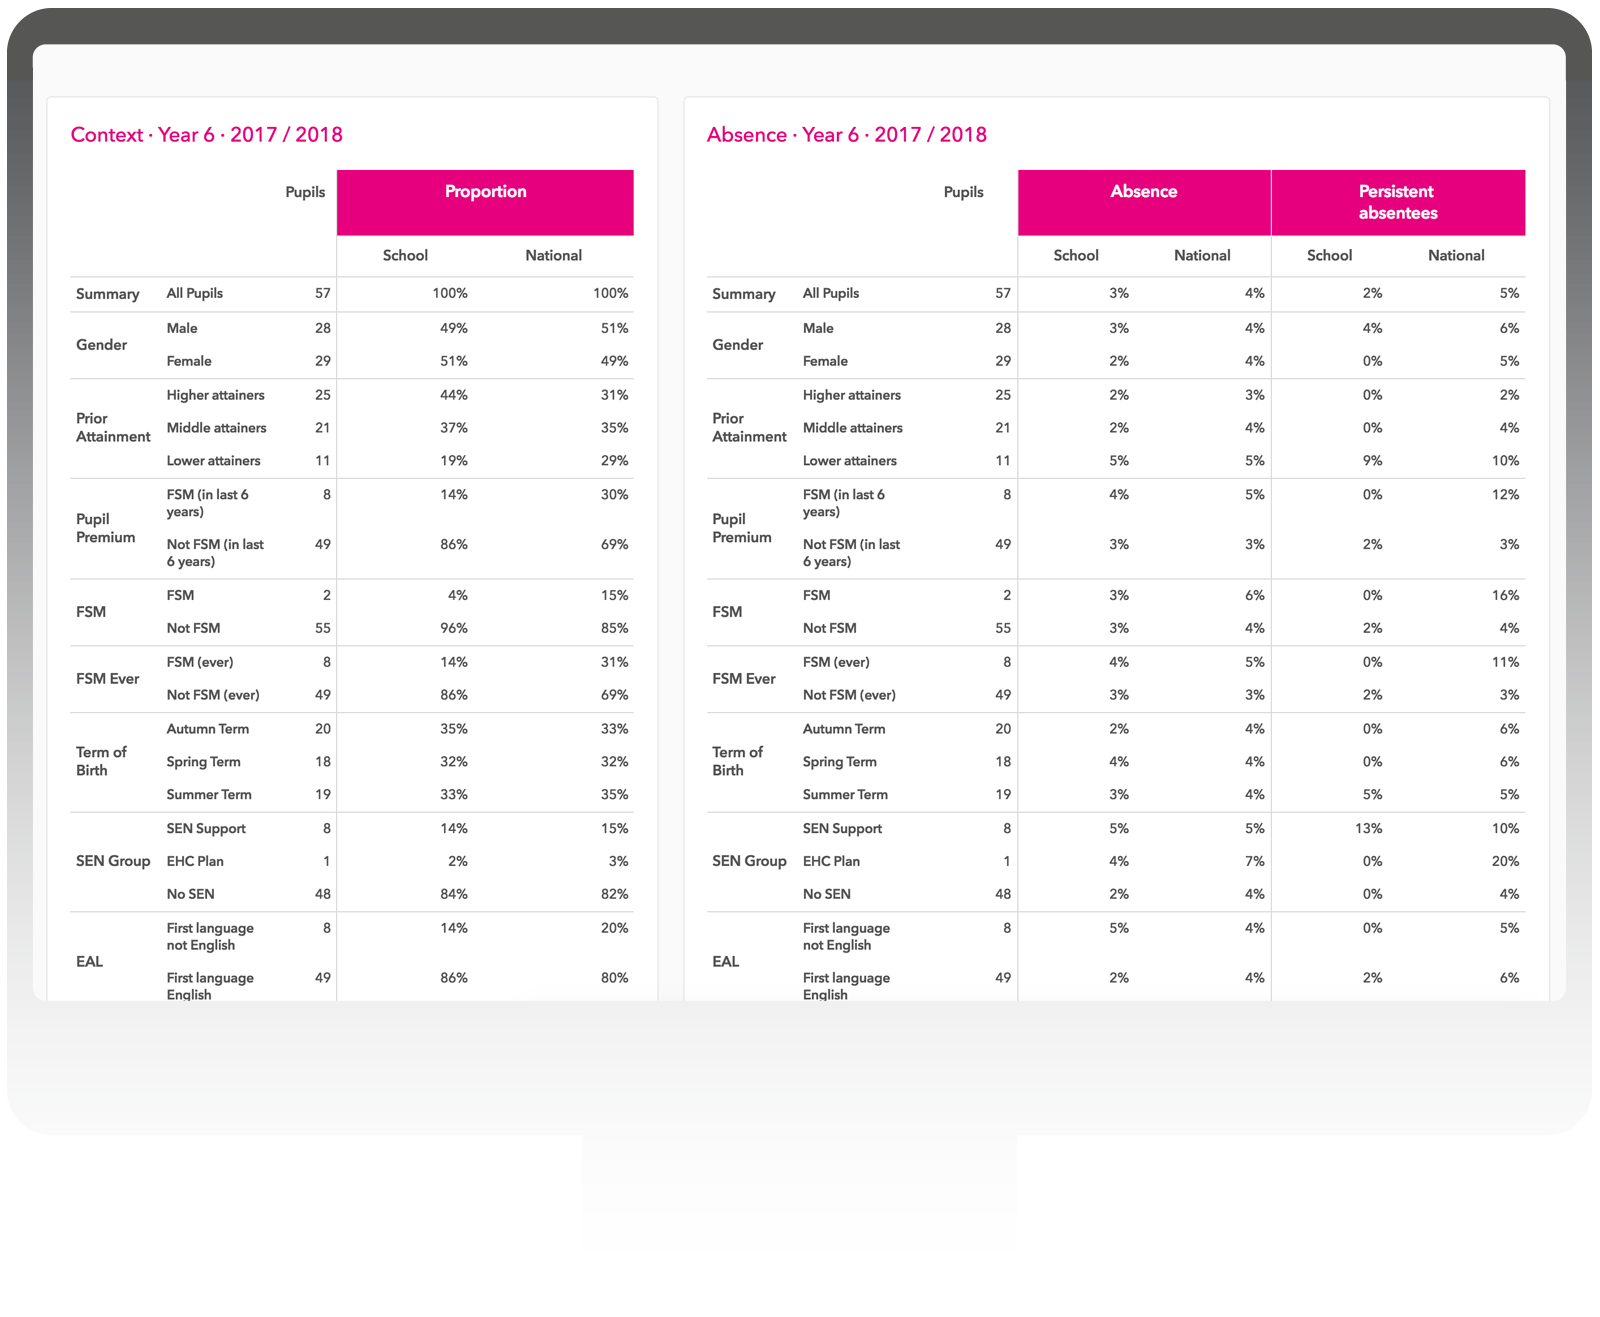
Context


A high level summary of your school’s performance including key strengths and weaknesses. Our dashboards use all the latest DfE measures along with an extended set of FFT indicators.

Analyse your attainment and progress over time. Completely configurable – filter your own group of pupils and compare their performance to similar pupils nationally. Create your own bespoke reports and dashboards.

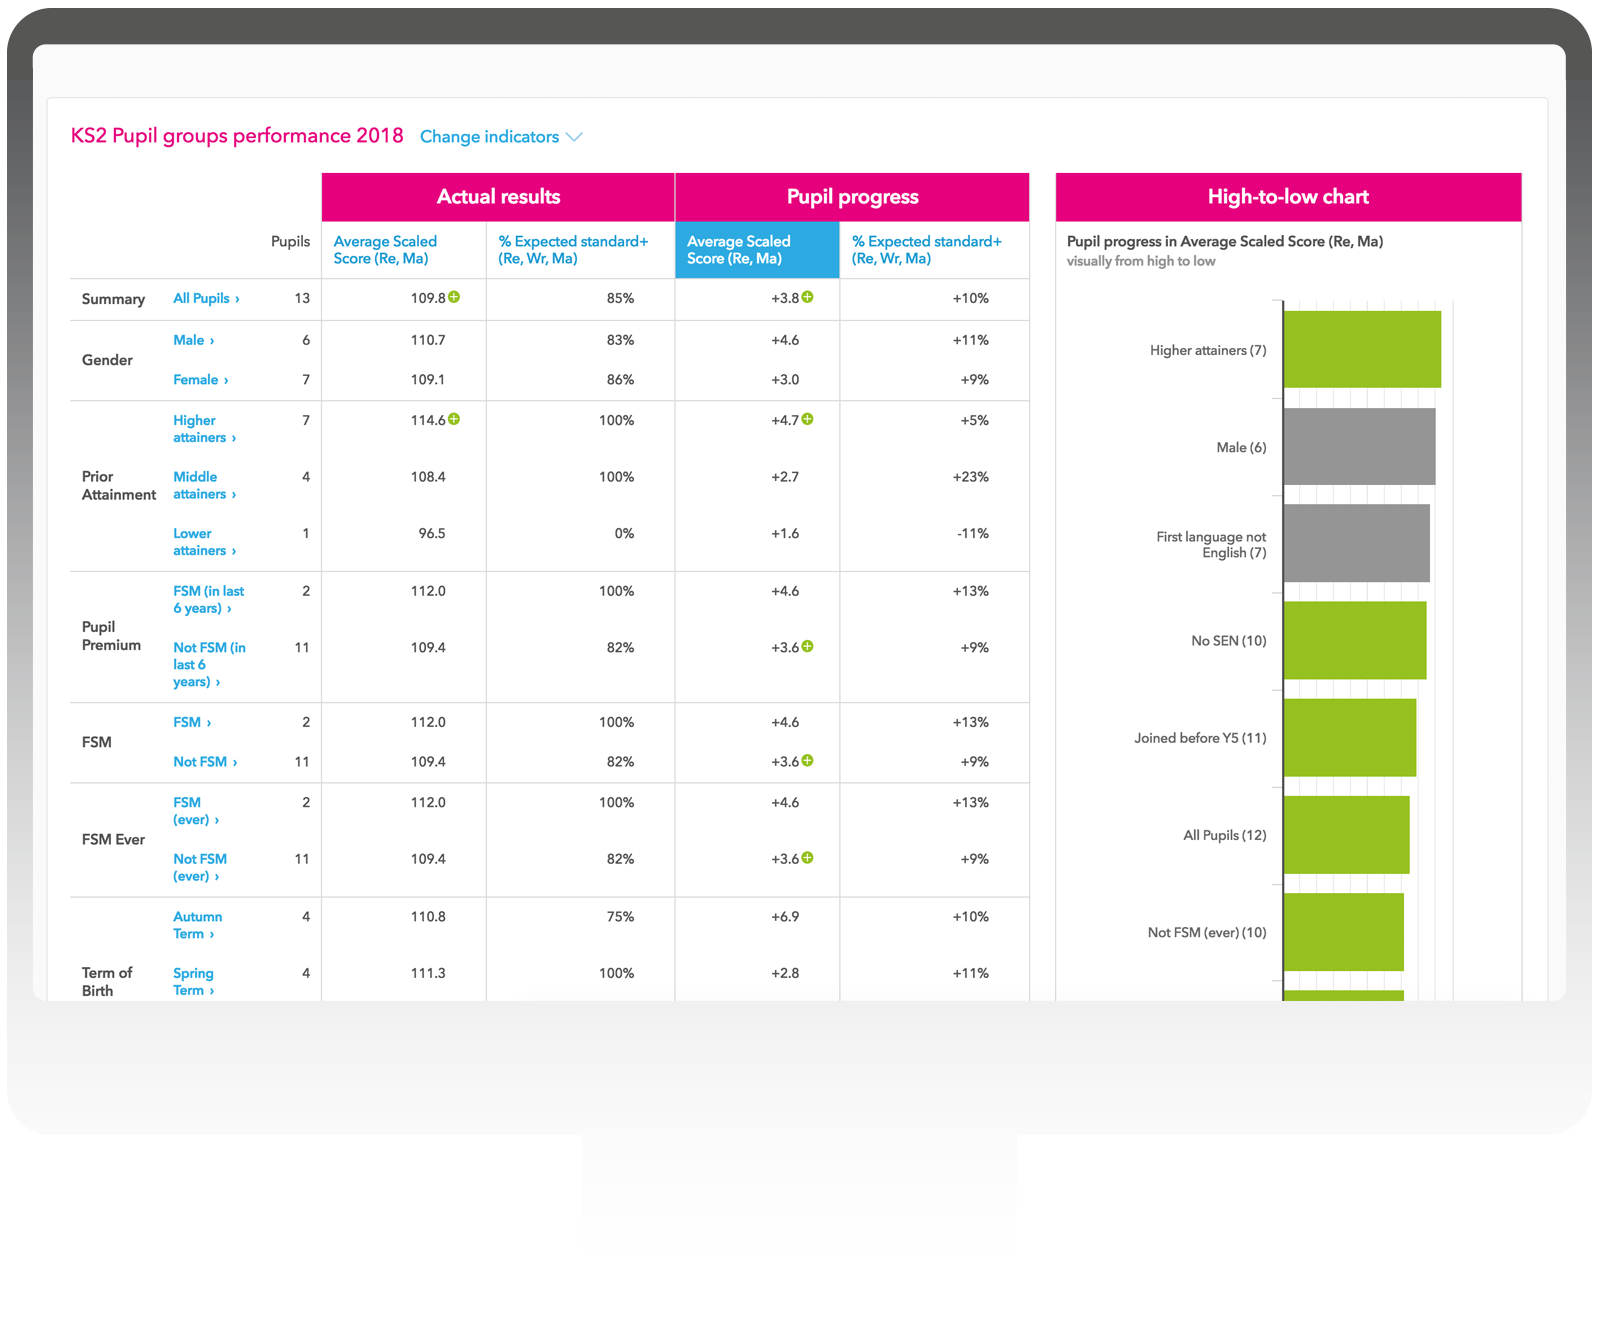
A comparative analysis of all the pupil groups in your school on a single page. The simple bar chart facility allows you to rank your groups from top to bottom in an instant.

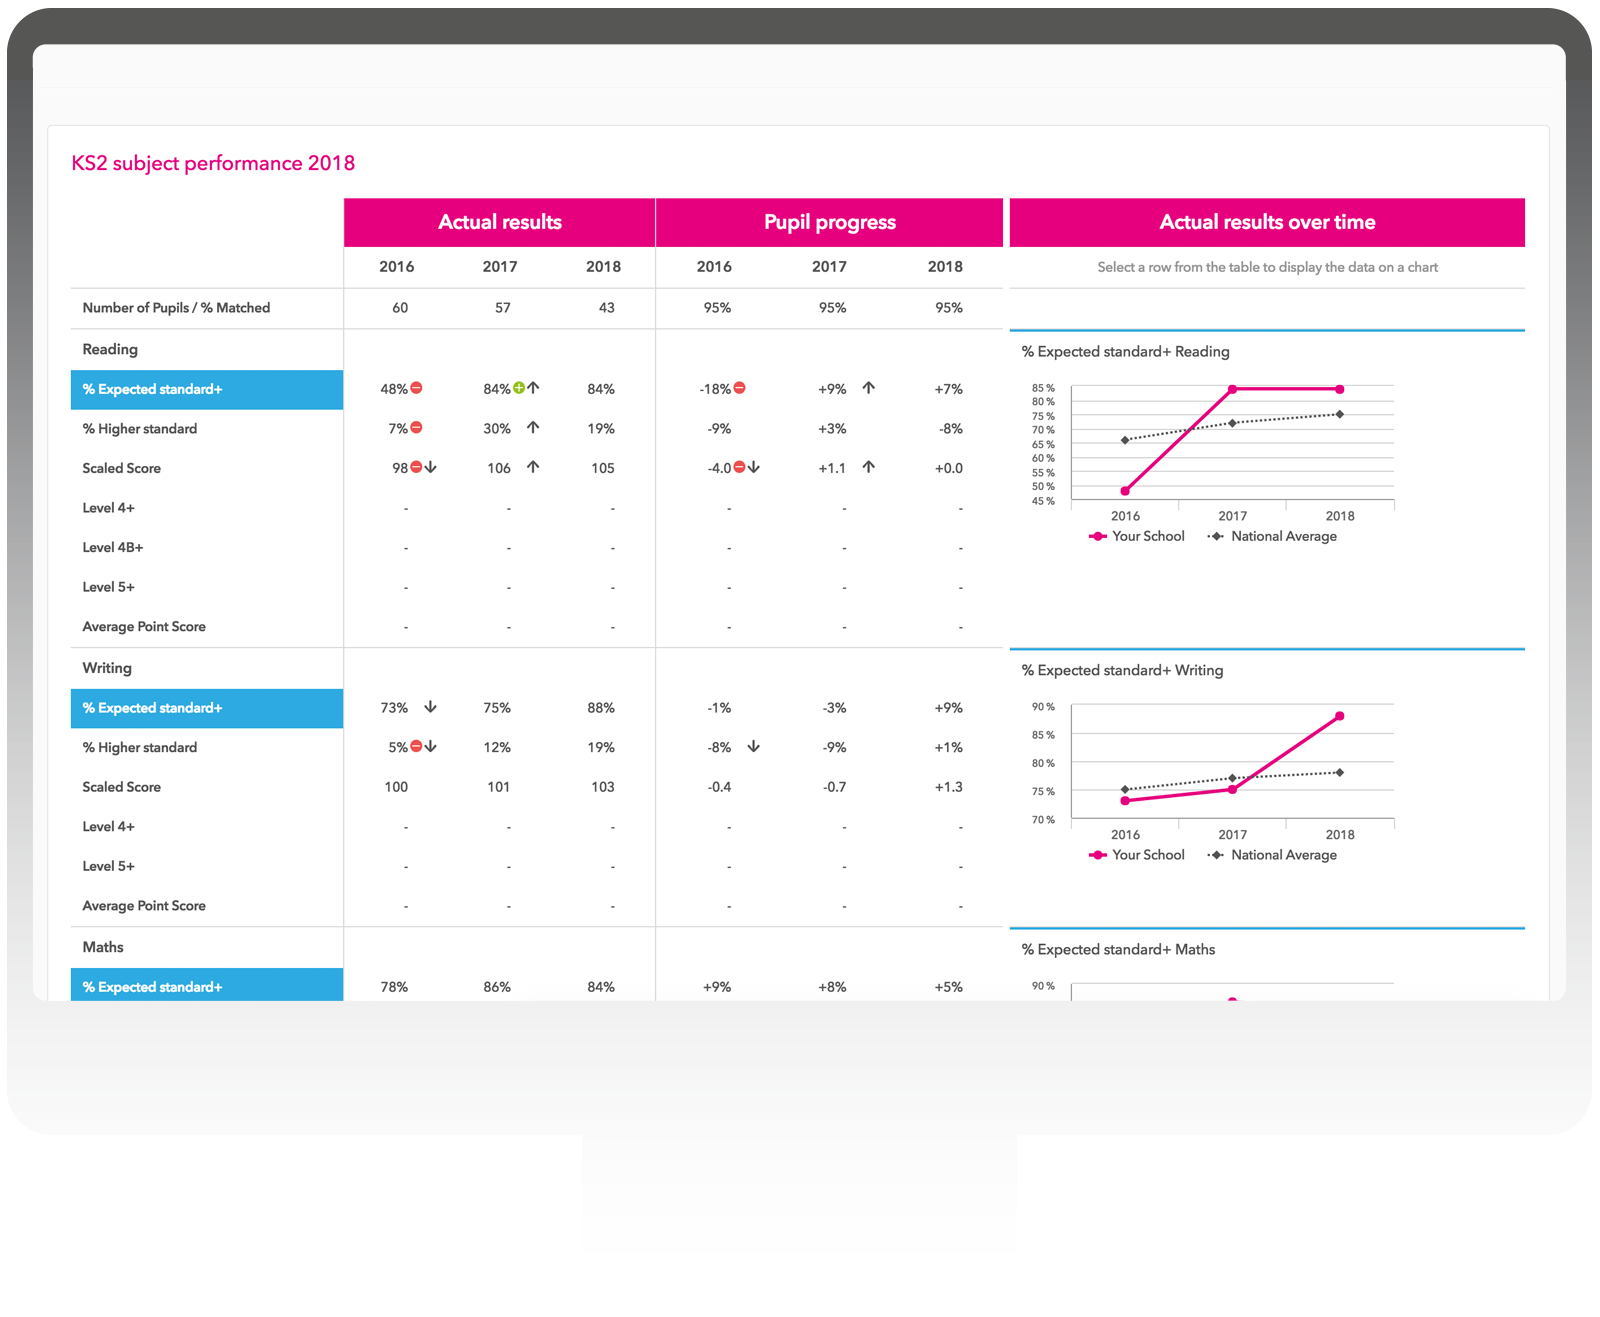
Compare attainment and progress across all key subjects in a single report. Clearly identify subject strengths and weaknesses. Analyse the performance of your whole school or filter the report for specific groups of pupils.

Evaluate progress and analyse gaps for disadvantaged pupils. A key report for inspection. Learn more

With Aspire, you can analyse results for individual pupils by comparing expected and actual rates of progress. Measure the success of your intervention strategies and use the data to inform future programmes of support.

Visualise and evaluate pupil performance. Extended version of RAISE/ASP functionality. Learn more

The Context report helps you to understand the profile and makeup of your cohorts. How do they differ from year to year? How do they compare to the national profile? Are absence rates consistent across different pupil groups?


“I now know the overall school standards compared to the national equivalents, and the performance of Pupil Premium pupils.

The visual representation of the data in dials and other pictograms makes analysis and evaluation much easier to present, and is very clear and easy to understand.”

Read the case study
 

Key features

Comprehensive evaluation

In just 8 reports, FFT Aspire provides a full evaluation of your school’s performance. It identifies strengths and weaknesses across different subjects and pupil groups using a full range of DfE attainment and progress measures alongside FFT contextualised progress indicators.

Simple & easy to understand

We have worked extensively with schools to ensure our dashboards are simple and easy to understand. Utilising a range of simple gauges, charts and tables, the dashboard allows you to quickly compare your attainment and progress to both national data and similar schools.

Fully interactive

The power of Aspire is in its interactivity. Select the Year group, Indicator, Subject or Pupil group to fit your needs or let FFT make the selections for you – the choice is yours.

A comprehensive performance analysis in a single PDF report? It's all available in our School Dashboard and Extended School Dashboard downloadable reports



The fastest way to see how your school performs.
Download an example KS1 School Dashboard now.

The fastest way to see how your school performs.
Download an example KS2 School Dashboard now.

The fastest way to see how your school performs.
Download an example KS4 School Dashboard now.

Discover more areas of Aspire

Estimates & targets

Review estimates, compare benchmarks, set targets

More

Pupil tracking

Track all your primary assessment data in real time
More

Attendance tracking

Live week-by-week attendance reporting for schools
More

Performance analysis

A detailed comparative analysis of results at the end of each key stage

More