
Take a look
Overview
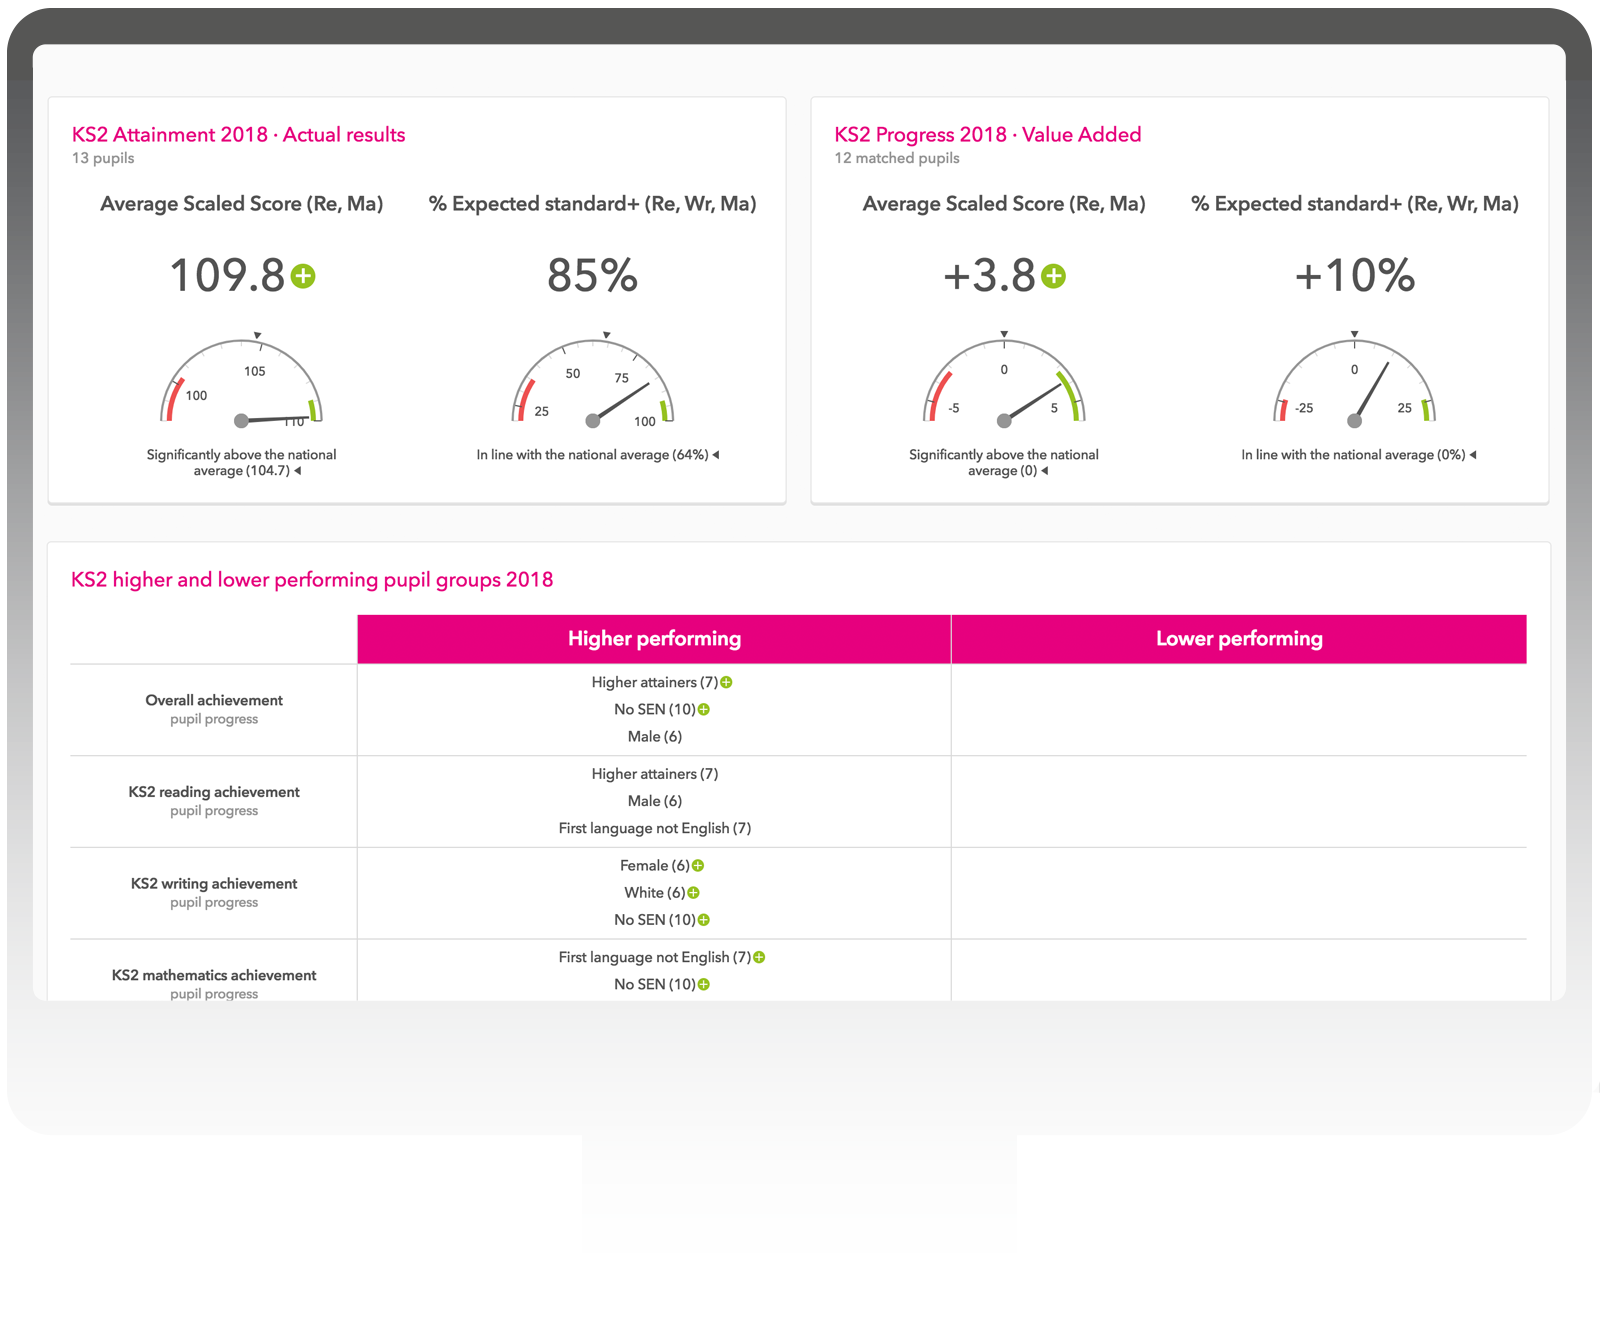
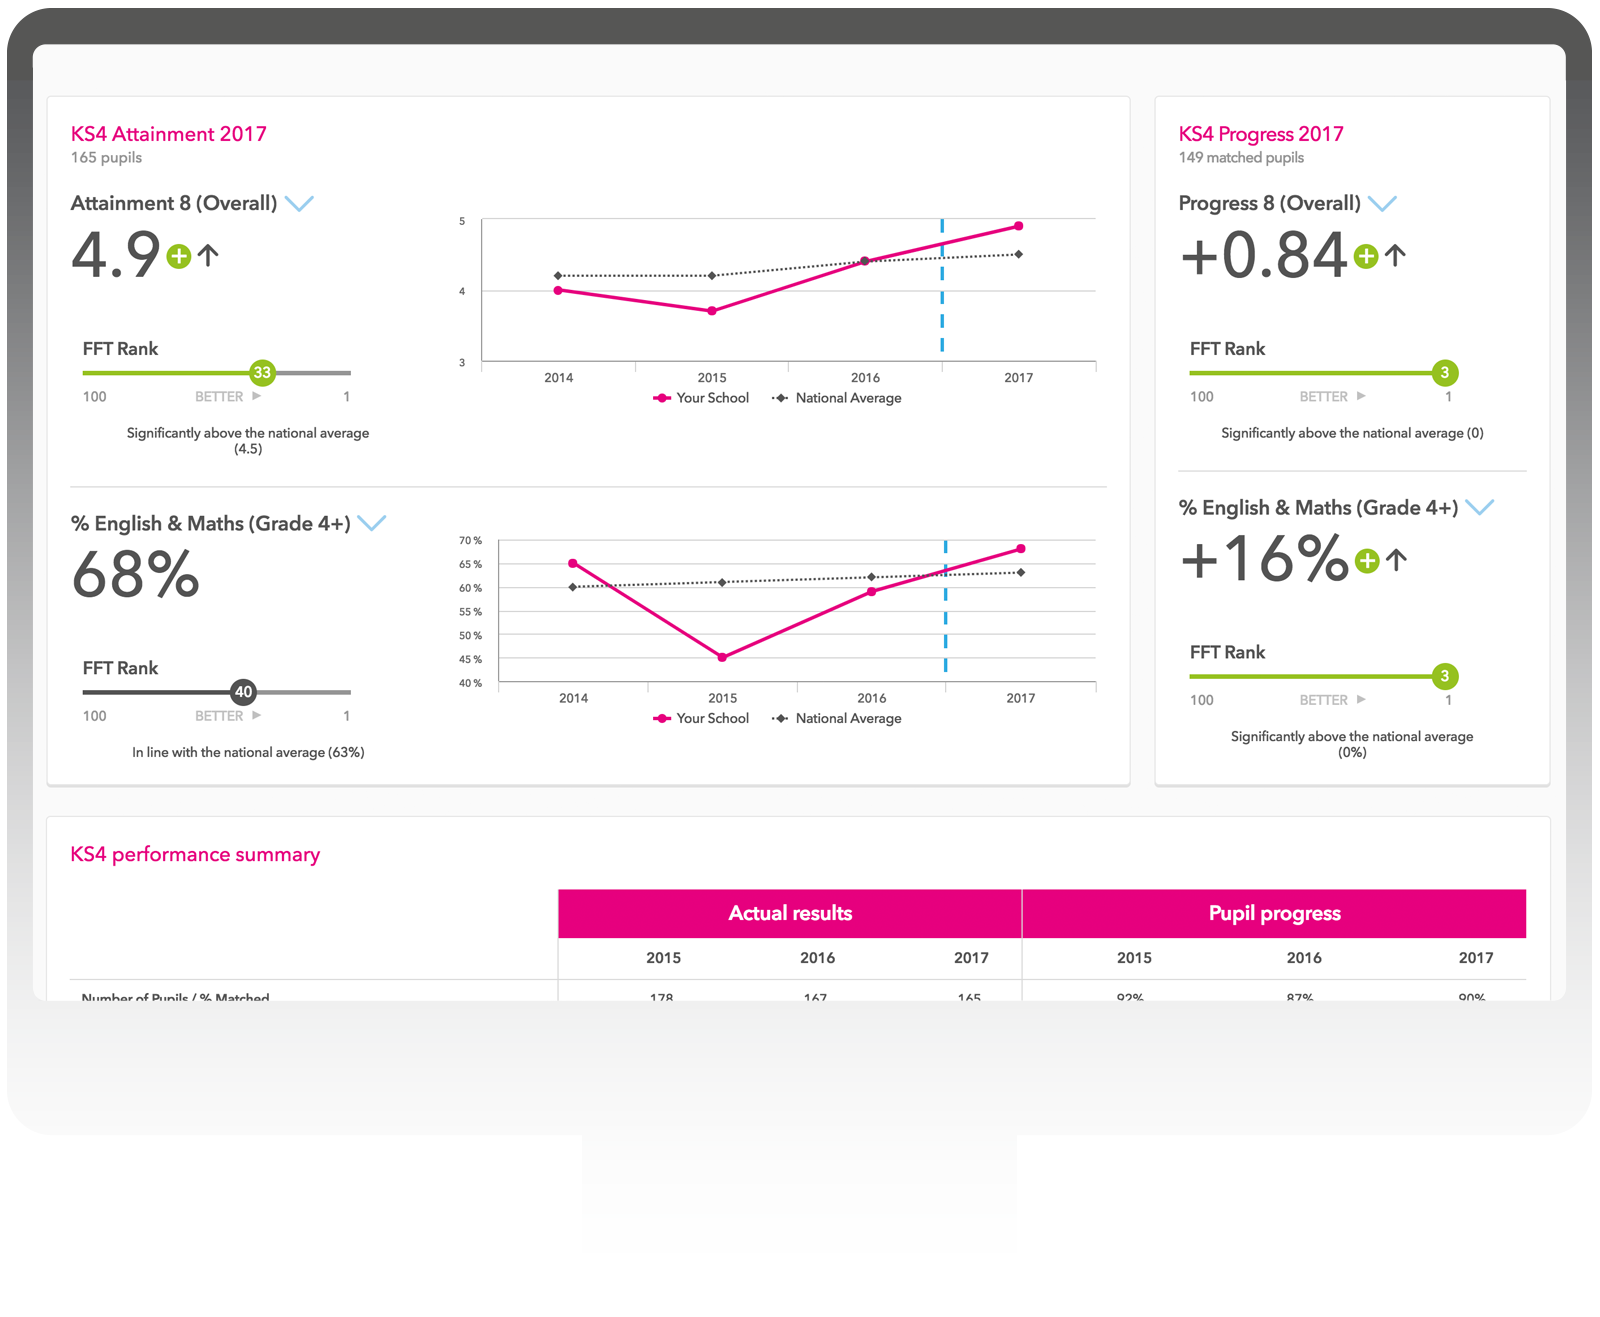
Attainment & progress
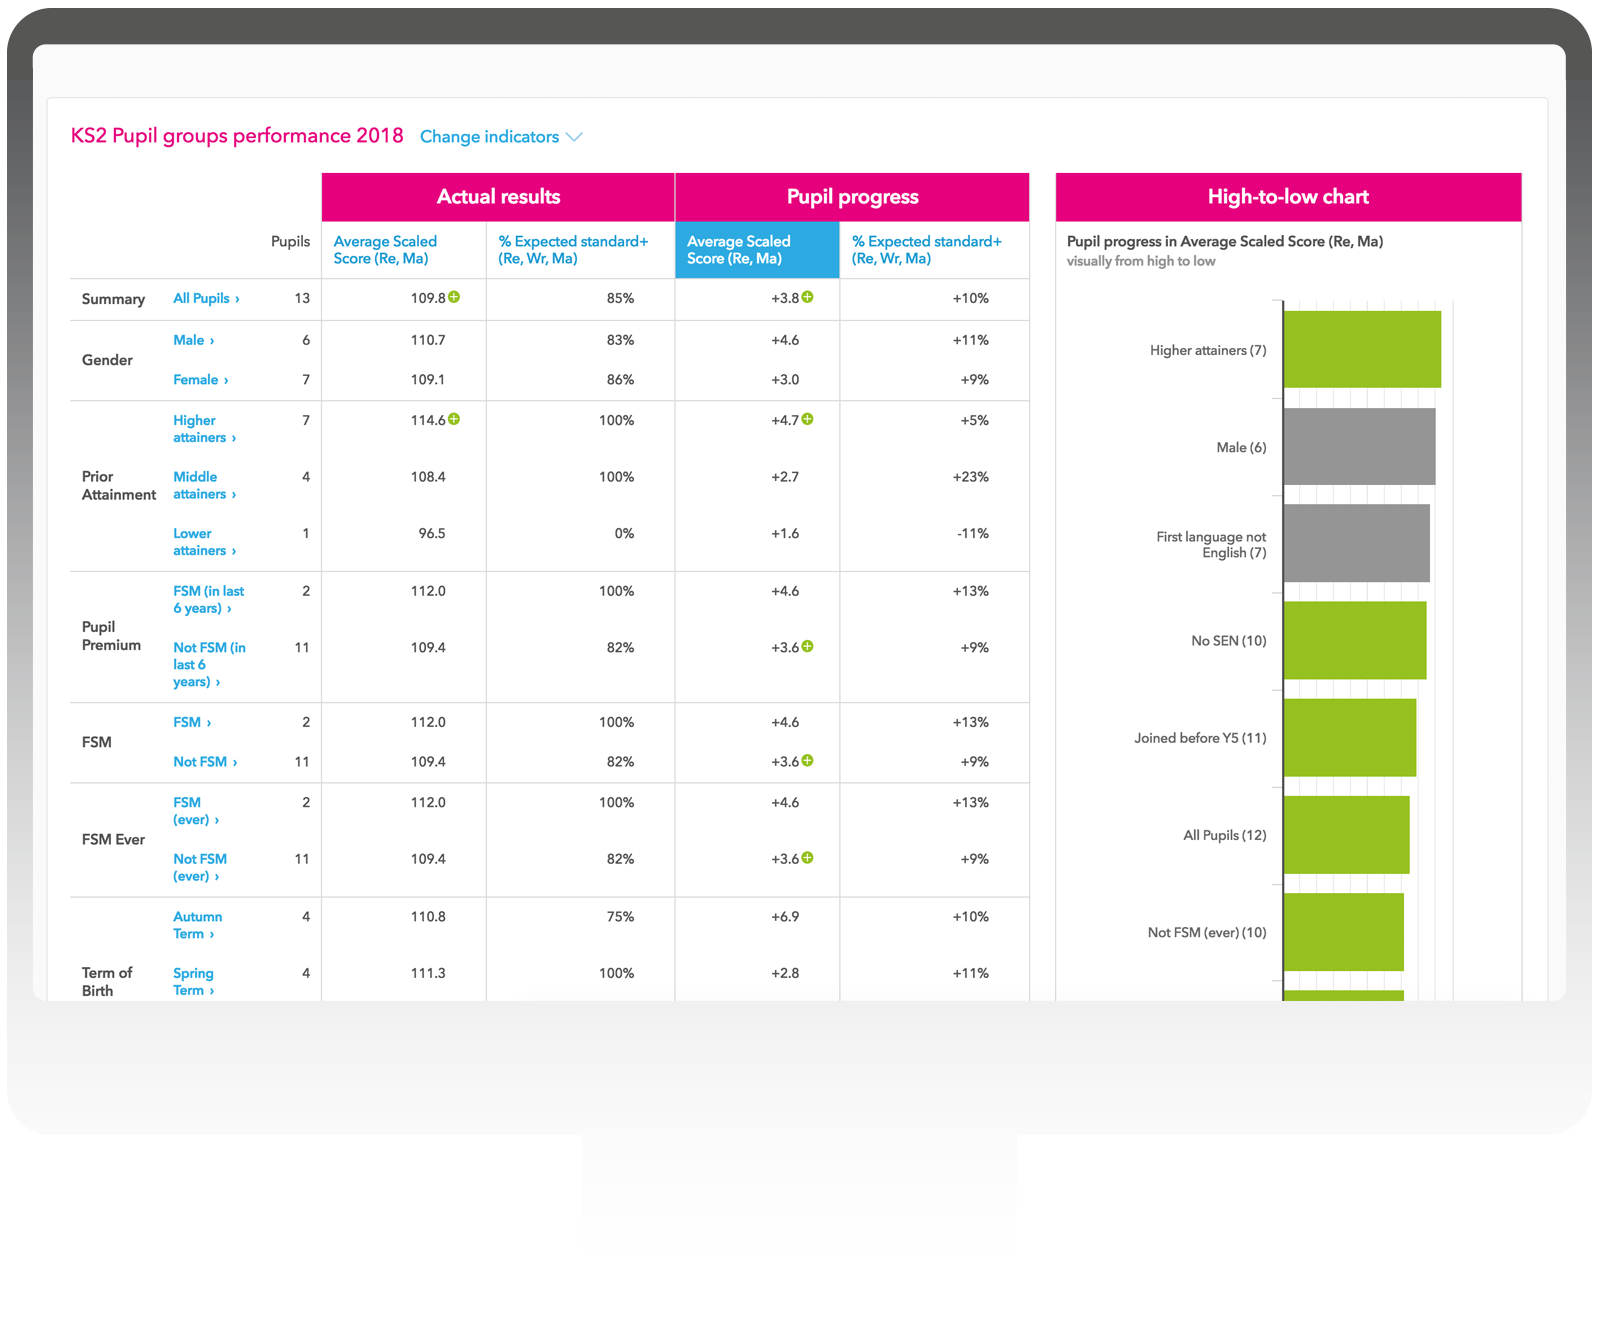
Pupil groups
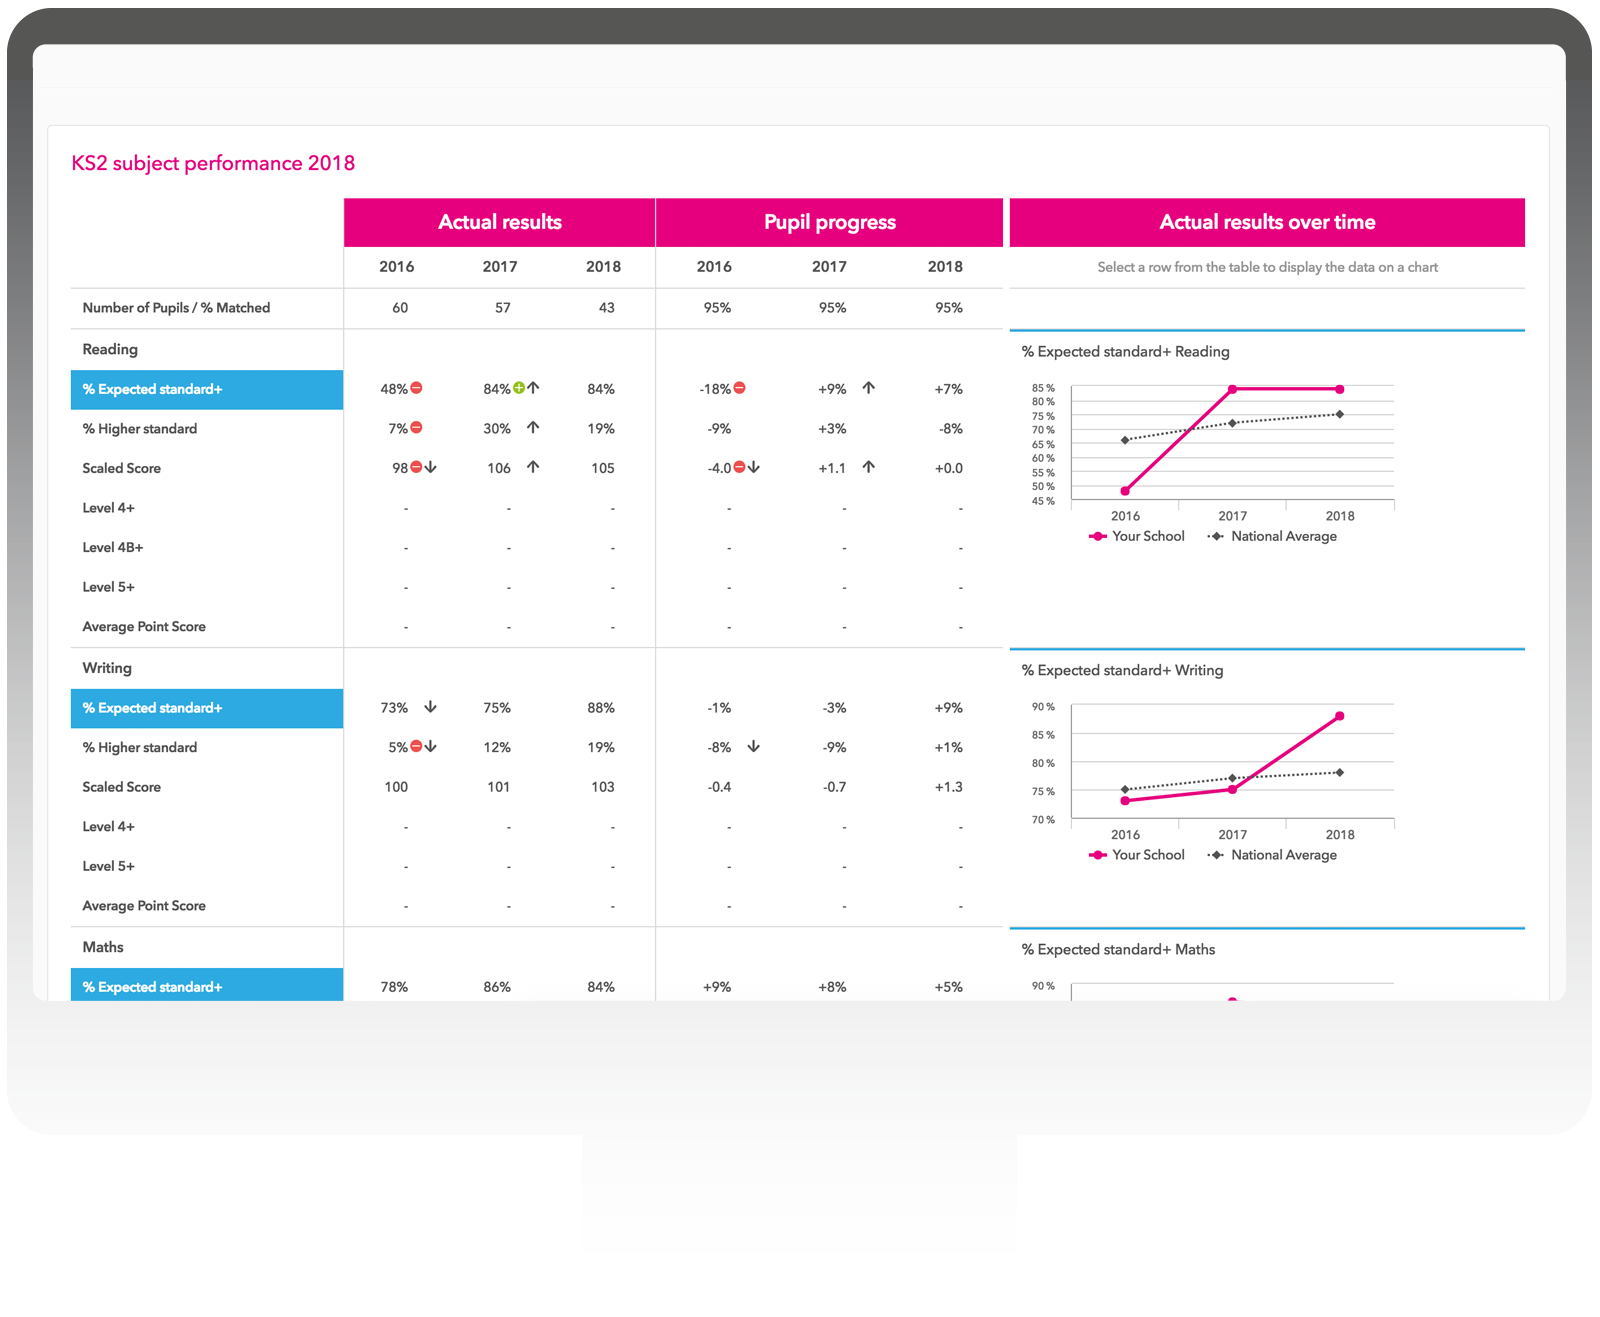
Subjects
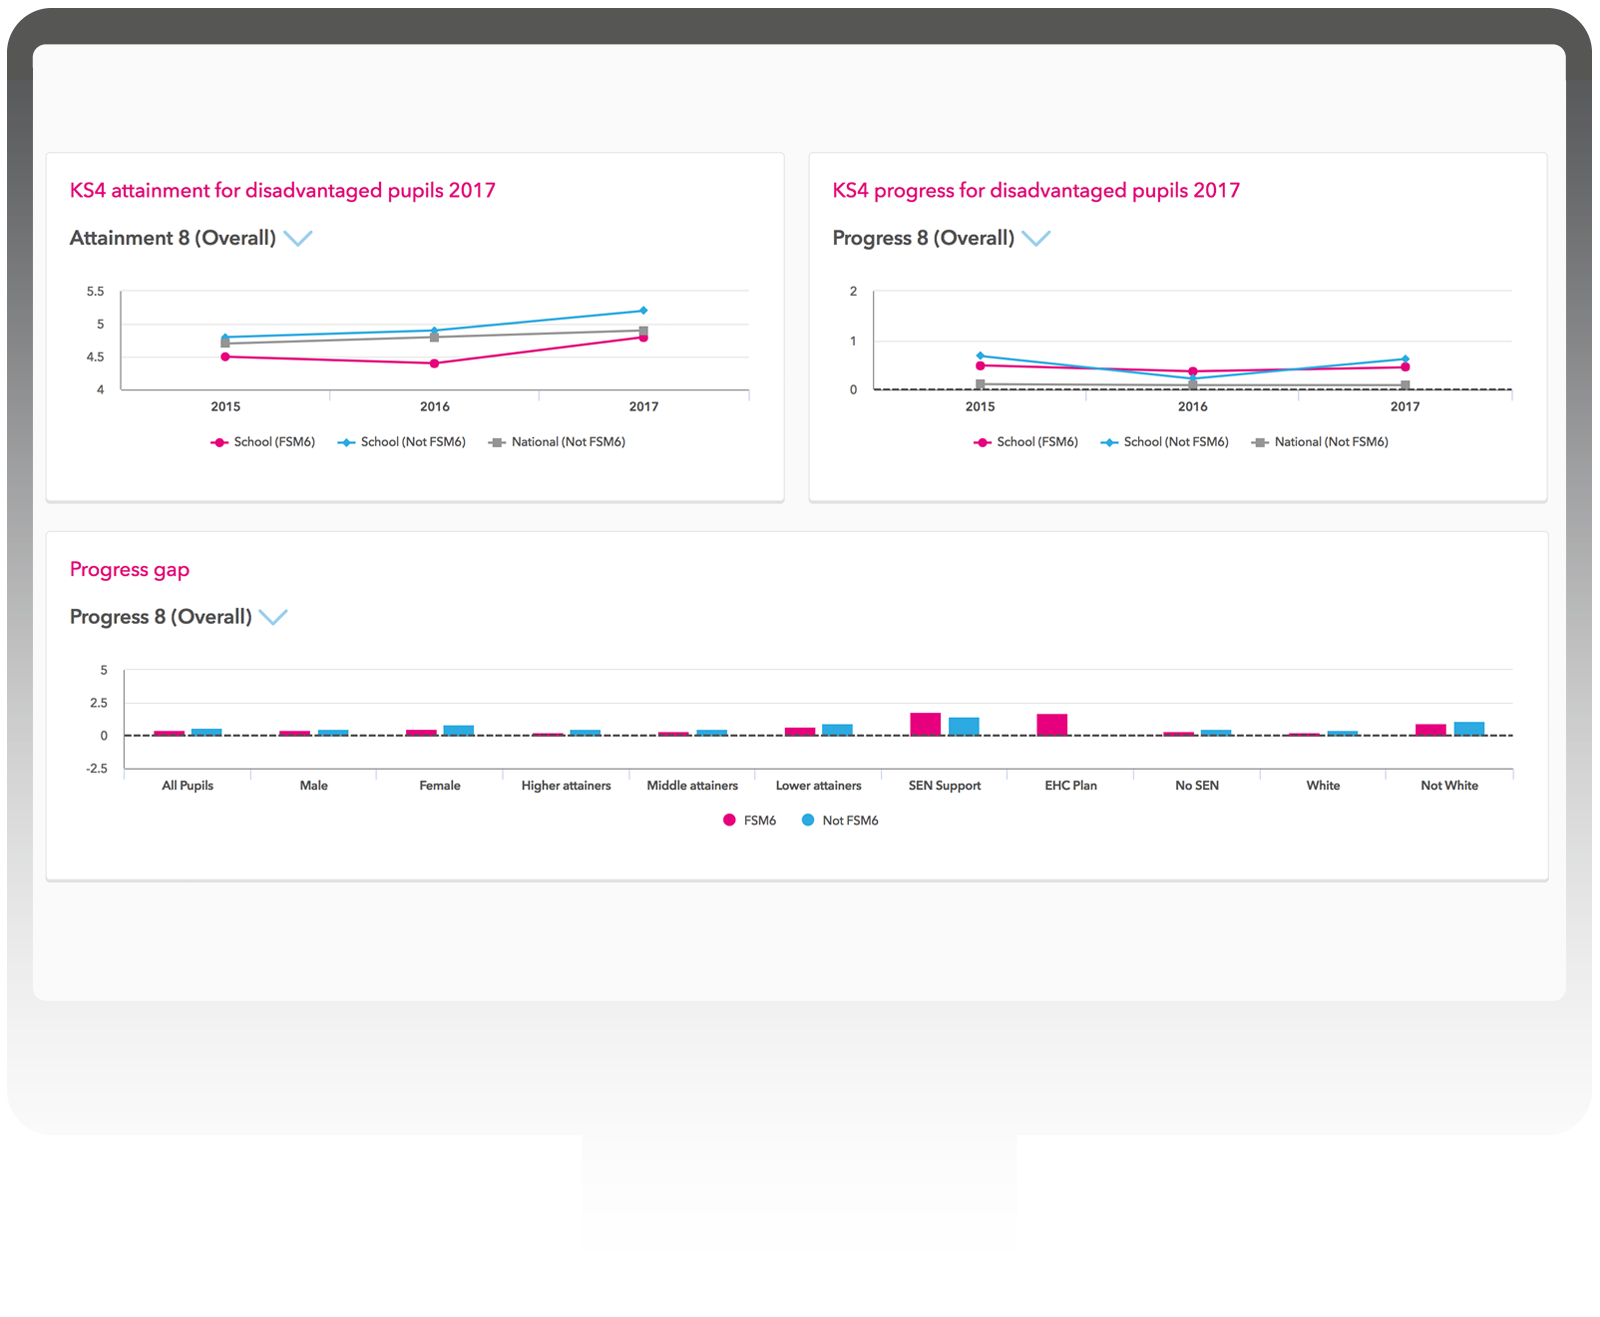
Disadvantaged pupils
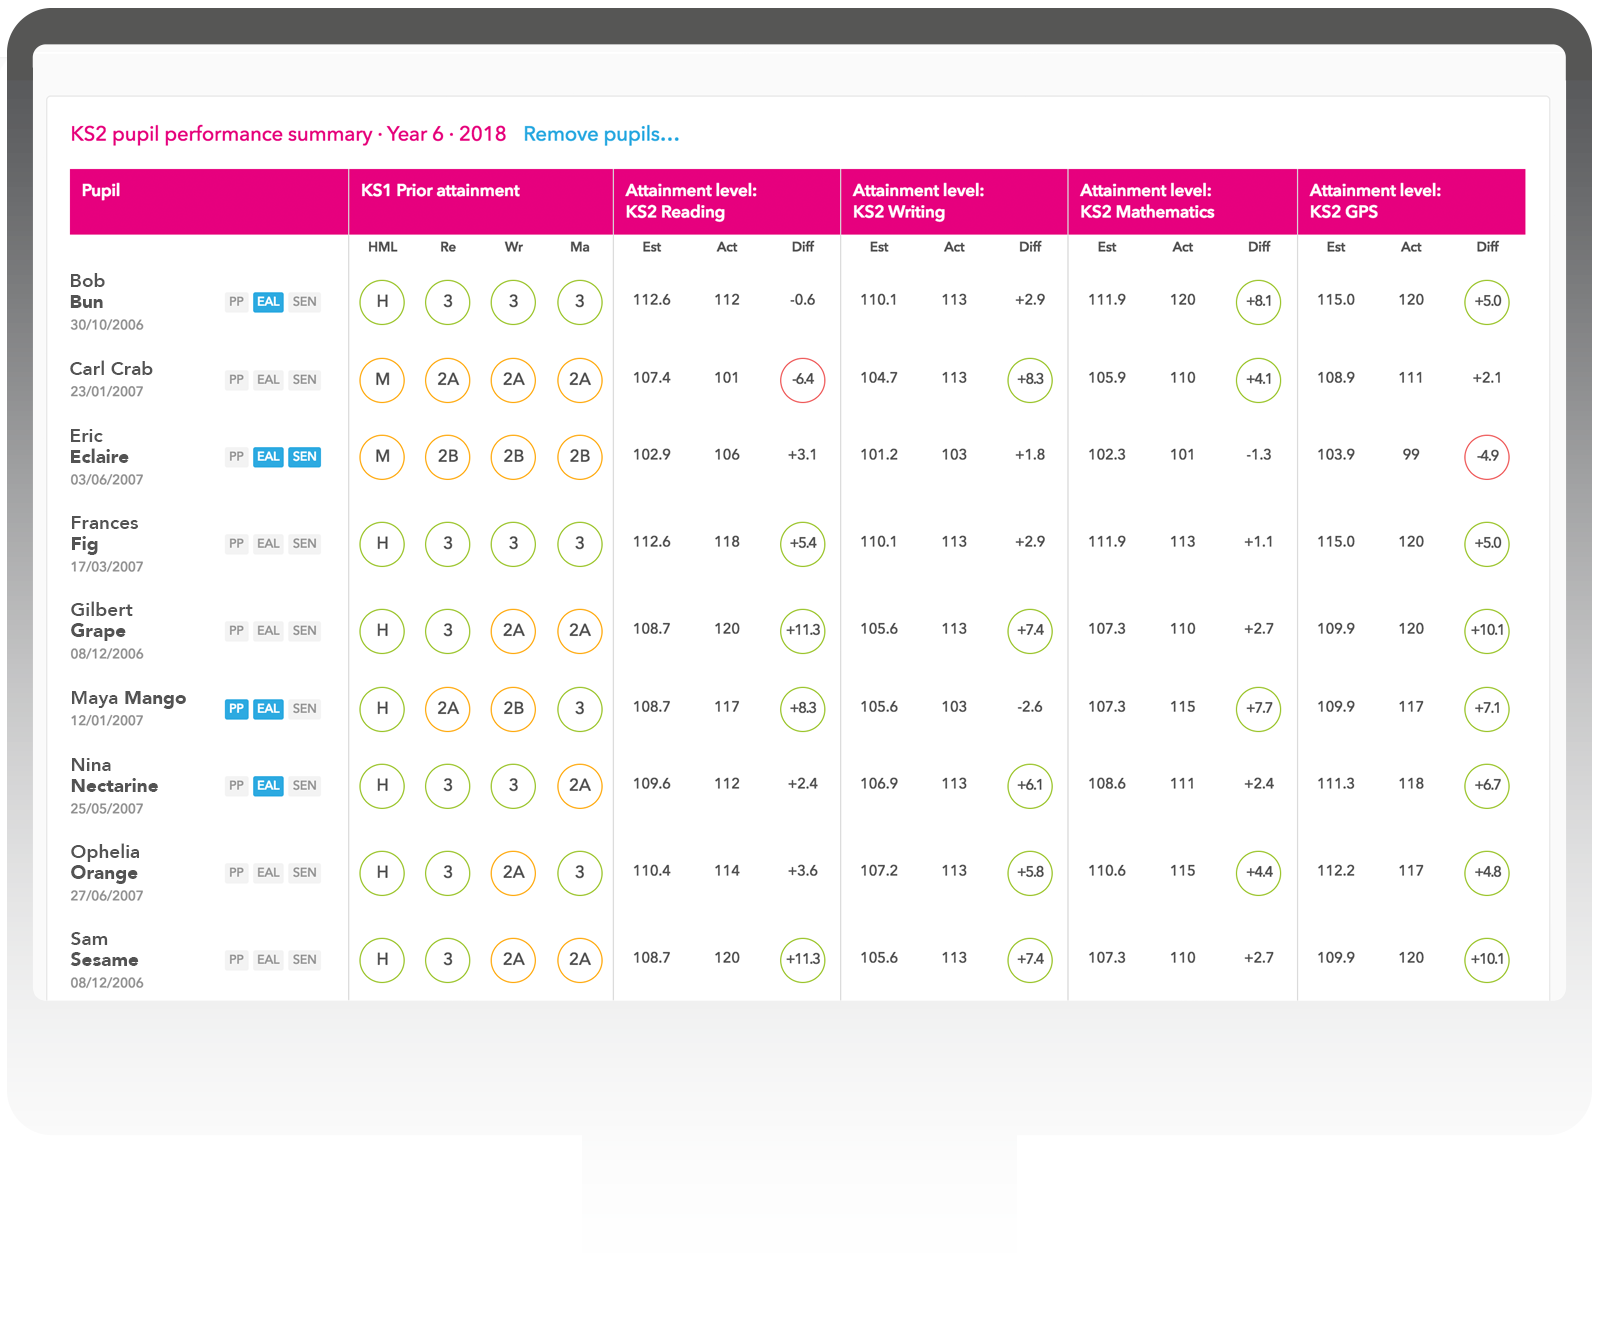
Pupils
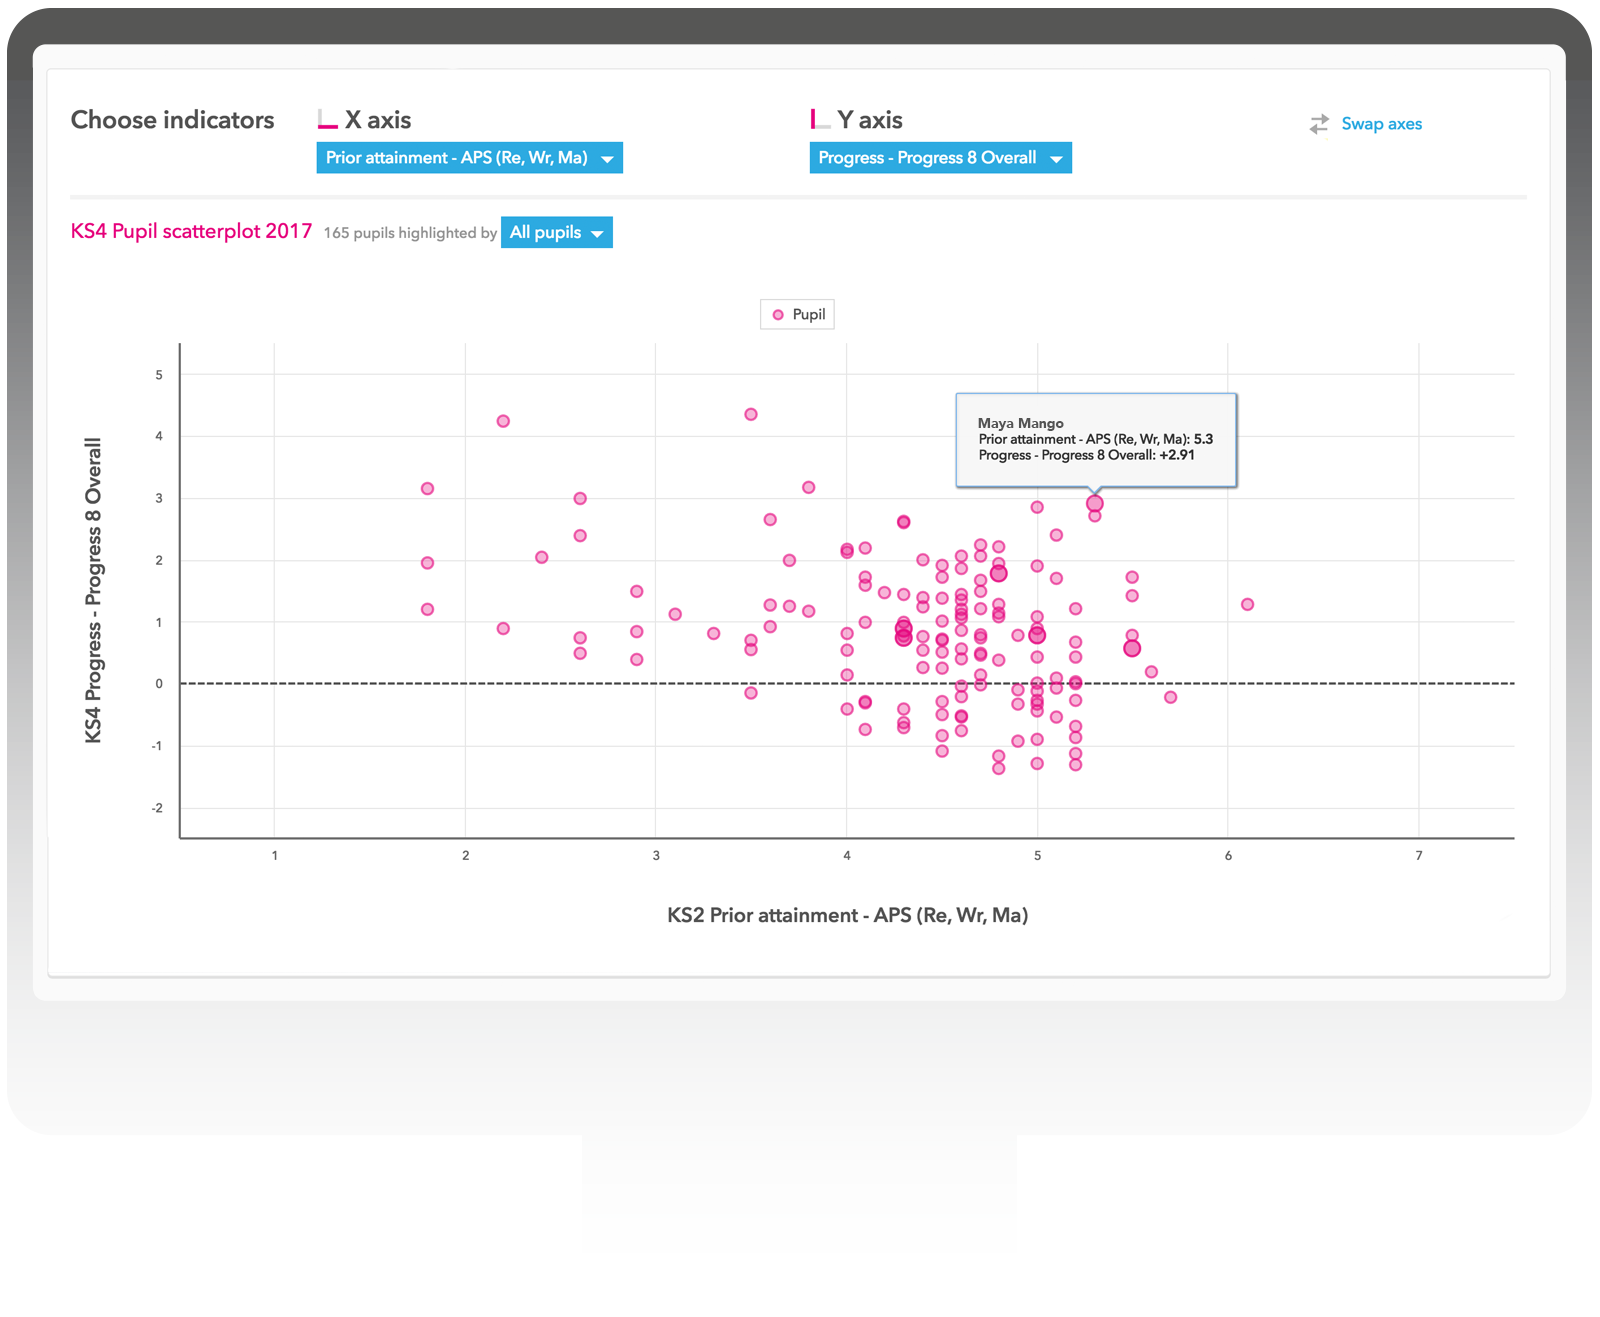
Scatterplot
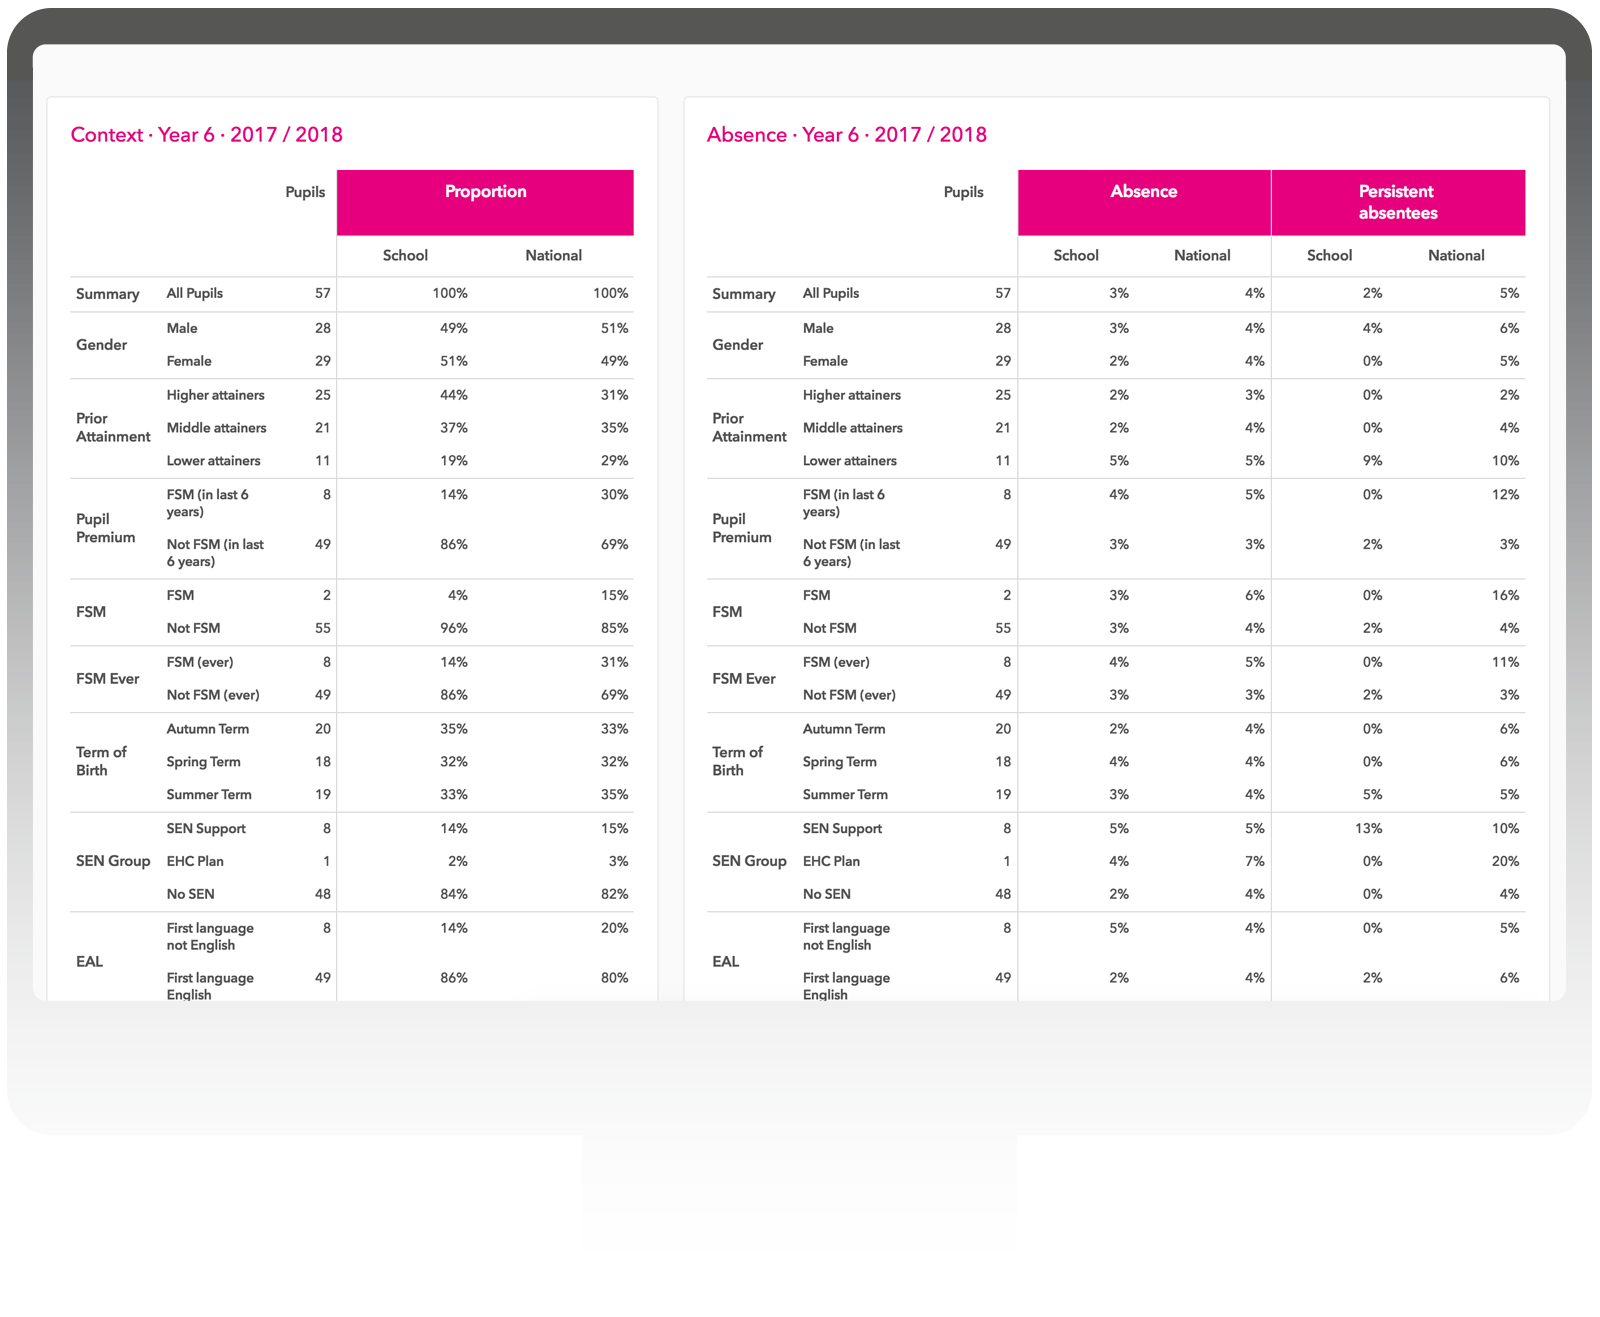
Context
Key features

Comprehensive evaluation
In just eight reports, FFT Aspire provides a full evaluation of your school’s performance. It identifies strengths and weaknesses across different subjects and pupil groups using a full range of DfE attainment and progress measures alongside FFT contextualised progress indicators.

Simple & easy to understand
We have worked extensively with schools to ensure our dashboards are simple and easy to understand. Utilising a range of simple gauges, charts and tables, the dashboard allows you to quickly compare your attainment and progress to both national data and similar schools.

Fully interactive
The power of Aspire is in its interactivity. Select the Year group, Indicator, Subject or Pupil group to fit your needs or let FFT make the selections for you – the choice is yours.
A comprehensive performance analysis in a single PDF report? It's all available in our School Dashboard and Extended School Dashboard downloadable reports

The fastest way to see how your school performs.
Download an example KS1 School Dashboard now.
The fastest way to see how your school performs.
Download an example KS2 School Dashboard now.
The fastest way to see how your school performs.
Download an example KS4 School Dashboard now.