
Reading Age Assessment: A Complete Guide for UK Schools
Decoding
accuracy with unfamiliar words
Fluency
speed and flow when reading aloud
Comprehension
understanding what’s been read
Vocabulary
the range of words a pupil knows
What is a reading age?
A reading age is a simple measure of how well a pupil reads, compared with other pupils their age. It comes from comparing a pupil’s score on a standardised test with the average score for each age, then reporting which age that score matches.
Schools like it because it’s easy to explain. When you tell a governor or a parent that a pupil’s reading age is 9.2, they understand it instantly, unlike a raw score. That’s the main reason schools ask for it, and why most reading tests report it alongside other measures.
What is a good reading age for a pupil's age?
A good benchmark is a reading age within about a year of a pupil’s actual age. Some variation between pupils of the same age is normal at every stage. Schools often start looking at additional support once the gap passes about a year, although the right threshold depends on the test used, the pupil’s starting point and your own school policy.
A single reading age doesn’t show why a pupil is behind. That’s why most schools treat it as a starting signal rather than the final word, pairing it with standardised scores and diagnostic data (covered below) before deciding on intervention.
How do schools assess reading age in the UK?
Reading tests UK schools use
| Test | What it offers |
|---|---|
| NGRT (GL Assessment) | Group-administered; reports standardised scores and reading ages. |
| PiRA (Hachette Learning) | Termly comprehension assessments, tracking progress across the year. |
| Salford Reading Test | Individually administered; often used for detailed diagnostic assessment. |
| Adaptive Reading Test (FFT) | Adaptive and digital; reports reading age (5–14), standardised score (70–130) and detailed decoding/fluency data in one sitting, Years 1–8. |
What “adaptive” means
Reading age vs reading attainment level vs standardised score
Reading age
Reading attainment level
Standardised score
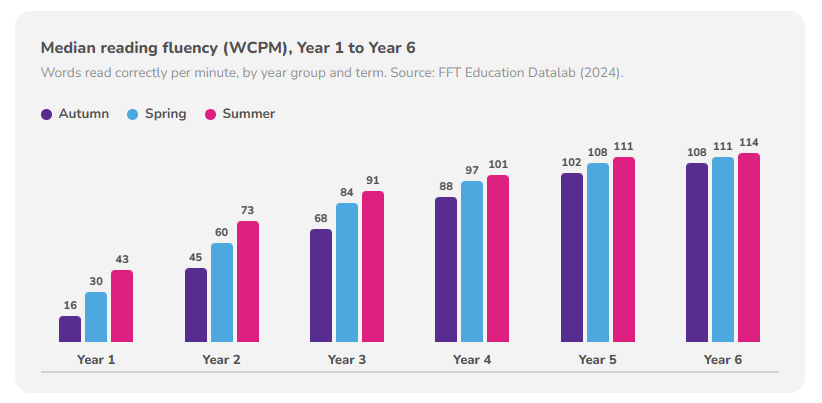
UK reading fluency benchmarks by year group
View full benchmark table
| Year group | Term | WCPM (median) |
|---|---|---|
| Year 1 | Autumn | 16 |
| Year 1 | Spring | 30 |
| Year 1 | Summer | 43 |
| Year 2 | Autumn | 45 |
| Year 2 | Spring | 60 |
| Year 2 | Summer | 73 |
| Year 3 | Autumn | 68 |
| Year 3 | Spring | 84 |
| Year 3 | Summer | 91 |
| Year 4 | Autumn | 88 |
| Year 4 | Spring | 97 |
| Year 4 | Summer | 101 |
| Year 5 | Autumn | 102 |
| Year 5 | Spring | 108 |
| Year 5 | Summer | 111 |
| Year 6 | Autumn | 108 |
| Year 6 | Spring | 111 |
| Year 6 | Summer | 114 |
Fluency varies widely within every year group. By the end of primary school, the lowest-attaining quarter of readers has a median of 72 WCPM, around four years behind the typical pupil. Pupils eligible for free school meals read at a median of 106 WCPM by age 11, against 120 WCPM for their peers. Fluency also correlates strongly with attainment: among the 3,623 Year 6 pupils in FFT’s linked KS2 sample, 42% of those reading below 100 WCPM met age-related expectations in the KS2 reading test, compared with 78% of those reading at 100–130 WCPM and 95% of those above 130 WCPM (r=0.68 overall).
The gap is starkest for pupils with SEND. Their median fluency at age 11 is 91 WCPM, against 121 WCPM for pupils without SEND, and FFT’s analysis suggests around two-thirds of the difference in KS2 reading scores between the two groups is linked to this fluency gap. For SENDCOs and inclusion leads, that makes fluency one of the most useful things to track and act on early, rather than treating it as a by-product of a wider assessment.
Reading age assessments in primary schools (Years 1-6)
FFT Reading Assessment Programme - Primary
Secondary schools and the year 8 reading test
Reading age assessment doesn’t stop at primary. A meaningful number of pupils arrive in Year 7 still reading below the level expected for their age. Without ongoing assessment, these gaps can go unnoticed until they start to affect access to the wider curriculum.
The government has confirmed a new statutory reading test for all Year 8 pupils in England, assessing reading fluency and comprehension. Final plans are due to be published in spring 2027, with the updated curriculum first taught from September 2028. The first cohort of pupils is expected to sit the test in May/June 2029, as part of the 2028/29 academic year. Results will be shared with parents; individual school results are not expected to be published nationally, in a similar way to the Year 1 phonics screening check.
This means secondary schools need reliable, ongoing data on reading ability well before the test arrives, not just a one-off check at the start of Year 7. FFT’s Reading Assessment Programme already supports this, identifying pupils reading below their actual age, including EAL learners and pupils with SEND, so support can start now, ahead of the statutory launch.
FFT Reading Assessment Programme - Secondary
Using the data to plan support and show impact
For SLT, SENDCOs and trust leaders, a reading age is a useful headline. The standardised score, Reading Attainment Level and diagnostic detail behind it are what stand up to scrutiny. When a governor, trust board or Ofsted inspector asks how you know an intervention is working, “reading age went up by eight months” is a good story; a before-and-after standardised score, alongside the specific decoding or fluency gaps closed, is the evidence.
Combining reading age, standardised score and Reading Attainment Level data lets schools:
How to choose and run a reading age assessment
For SLT, SENDCOs and trust leaders, a reading age is a useful headline. The standardised score, Reading Attainment Level and diagnostic detail behind it are what stand up to scrutiny. When a governor, trust board or Ofsted inspector asks how you know an intervention is working, “reading age went up by eight months” is a good story; a before-and-after standardised score, alongside the specific decoding or fluency gaps closed, is the evidence.
Combining reading age, standardised score and Reading Attainment Level data lets schools:
Reading age tests: FAQs for schools
Sources
- FFT Education Datalab (2024) — ffteducationdatalab.org.uk/2024/11/measuring-reading-fluency-during-primary-education — reading fluency benchmarks and the link between fluency and end-of-primary results
- Department for Education — confirmation of the statutory Year 8 reading test (October–November 2025 announcements)
- DfE Reading Framework — official guidance on reading in primary schools
- Education Endowment Foundation — literacy guidance